
 by Bill Tracy
Many folks are trying to interpret the Environmental Protection Agency’s final Clean Power Plan (CPP) and its impact on Virginia. The EPA, along with its August 3 rule announcement, released a large volume of on-line support material including the popular State-at-a-Glance Summary sheets.
Unfortunately, Virginia’s state summary sheet is misleading. EPA made relatively large adjustments to Virginia’s 2012 Base Case, not shown on the state summary sheet. The adjustments were necessary to account for natural gas power plants that were already under construction. The 2030 final targets for Virginia do not seem logical unless you compare them against EPA’s adjusted 2012 base numbers.
Fortunately, EPA does give us enough source data in the State Goal Visualizer spreadsheet to allow me to calculate the adjusted 2012 base, shown below, according to my math:
Carbon intensity (pounds of CO2 emission per megawatt/hour of electricity):
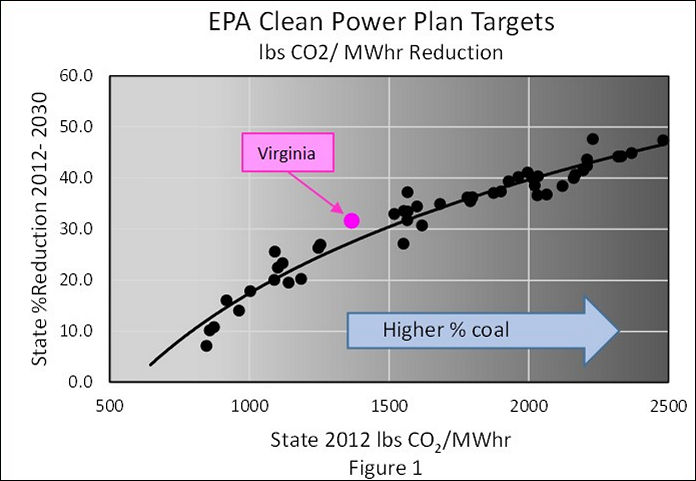
2012 lbs CO2/MWhr: 1,477
2012 lbs CO2/MWhr: 1,366 (EPA Adjusted 2012 Base)
2030 lbs CO2/MWhr: 934
Total CO2 emissions permitted:
2012 CO2 Short Tons Mass: 27,365,439
2012 CO2 Short Tons Mass: 35,733,501 (EPA Adjusted 2012 Base)
2030 CO2 Short Tons Mass: 27,433,111
Now we can see that Virginia’s mass CO2 reduction target (23.2%) makes a lot more sense. The actual degree-of-difficulty is better described by the carbon intensity data (CO2 per MWhr), and Virginia’s 934 lbs target works out to a 31.6% CO2 reduction mandate.
To see how Virginia compares, I’ve hand-entered the data for all 50 states and plotted them up (see the graph above). The first conclusion that jumps out is how well Virginia (in purple) is doing, already operating at relatively low CO2 emission rates. The second conclusion is that Virginia does indeed seem to fall above the trend line, with our 31.6% CO2 reduction target. A bit lower target (27.5% reduction) would appear more equitable, assuming my trend line is correct. Virginia’s final carbon intensity mandate (934 lbs CO2/MWhr) could have been closer to a more manageable 1,000 lbs CO2/MWhr.
Those familiar with these numbers will recognize that 934 lbs CO2/MWhr is the approximate CO2 yield of a clean natural gas power plant. In others words, Virginia probably cannot operate many coal plants and still meet their 2030 CO2 target. In fact, EPA seems to be assuming that Virginia will shut down all but one coal plant by 2020, before CPP even kicks in. I’ve asked EPA to check their numbers to see if there is an error on the Virginia state summary sheet data for 2020.
Bottom line for me is that the Virginia CO2 targets appear very challenging. But somebody needs to check my numbers, and preferably EPA should show their adjusted 2012 base numbers on the State-at-a-Glance summary sheets. Meanwhile please be advised that most of the Virginia CPP information out there on the Web is using our non-adjusted 2012 base data.
Bill Tracy is a retired engineer, concerned citizen, and grandfather residing in Burke, Virginia.

