
Here we go again. The Virginia Department of Education (VDOE) has released SAT college-readiness test scores for Virginia high school graduates. And just as Virginia’s young people clobbered their peers nationally in the ACT college-readiness test scores, so they did in the SATs.
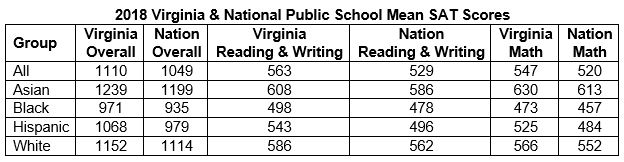
As can be seen in the table above, Virginia scores for public school students were higher in every category for both reading & writing across the four main racial/ethnic categories.
“We now have two years of performance data from the revised SAT and Virginia students continue to outperform their nationwide peers by wide margins,” Superintendent of Public Instruction James Lane said in a press release.
Of course, there’s more than meets the eye to these statistics. In a recent post (“More Test Score Sleight of Hand“) I showed how Virginia’s higher test scores in the ACT exams could be attributed largely to a lower percentage of students taking the exam than in other states. As I explained: “When participation is so discretionary, it is safe to assume that the Virginia test-takers are a highly self-selected group — more serious about going to college, better prepared academically, and more likely to earn high ACT scores.”
I wondered. Are we seeing the same thing in the SATs?
This year 68% of all Virginia high school graduates took the SATs — significantly more than the 36% average for the nation. One would expect that differential to depress Virginia scores, making the higher average scores for Virginia students all the more impressive. So, perhaps VDOE was justified in crowing about the positive results.
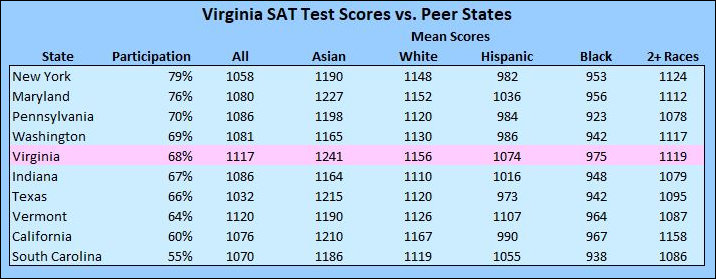
But comparing Virginia to the national average is tricky. The national average reflects some wild extremes. The SAT participation rate varies from 2% in South Dakota to 100% in Delaware and Colorado. Only a modest number of states had participation rates in the middling range that Virginia did. Therefore, for the benefit of discerning Bacon’s Rebellion readers who want a deeper level of analysis, I have compared Virginia to other states with comparable participation rates. Further, because SAT scores vary by race/ethnic group and the preponderance of those groups vary by state, I also compare Virginia whites, Asians, African-Americans and Hispanics to their peers in other states.
(Literally, as I write these words, I do not know what the results will be. Drum roll, please…)
And the results are in!
With this methodology Virginia still comes out ahead of its peers with comparable participation rates. The performance gap isn’t as wide as depicted in the VDOE data comparing Virginia against national averages, but it’s still pretty convincing. Not only is the average score for all students higher than any of its peers (except Vermont, which I’ll discuss below), Virginia students of each racial/ethnic category almost uniformly out-perform their peers in other states.
(Hey, Amazon, see that? Virginia’s high school grads got higher SATs than the state of Washington’s!)
Bacon’s bottom line: I’ve never hesitated to chastise the VDOE for the way it puts a happy face on its data. But in this case, the Department appears to have exaggerated Virginia’s superior performance only slightly by making comparisons to the nation as a whole rather than states with like participation rates. If you accept the validity of SAT test scores as a predictor of college academic performance, it is fair to say that Virginia high school graduates are, in fact, better prepared overall for college than their peers in other states.
(The only one of the peer states to outperform Virginia on average SAT scores for all students was Vermont. According to College Board date, Vermont scored 112o compared to 1117 for Virginia. Yet Virginia Asians outperformed Vermont Asians, as did whites and blacks, while only Vermont’s Hispanics, constituting a mere 3% of the test takers, outperformed Virginia’s. That doesn’t add up. I’ve double-checked the College Board numbers. No typos. I have no explanation for the anomaly.)
Leave a Reply
You must be logged in to post a comment.