Where Have All the Heart Attacks Gone?

by Carol J. Bova

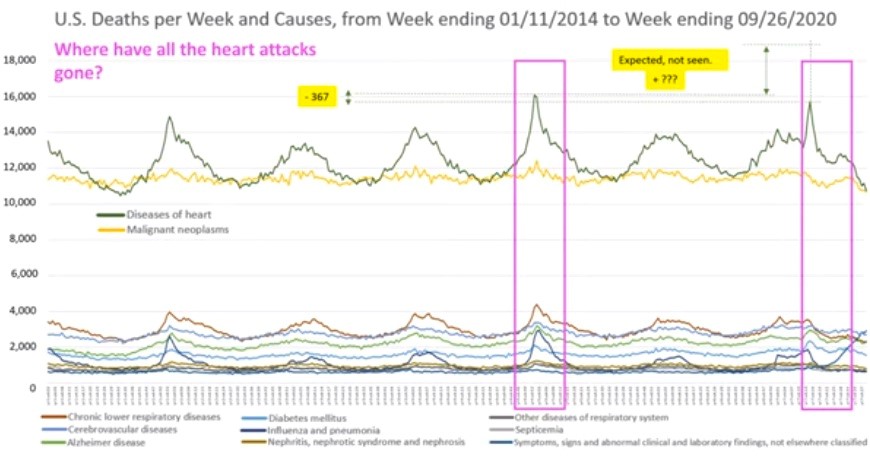
The Johns Hopkins University News-Letter published an article earlier this month asking, “Where have all the heart attacks gone?” The study questioned whether the U.S. COIVD-19 death rates are being overstated by omitting deaths usually attributed to attacks and cancer. The study was pulled four days later.

Dr. Genevieve Briand, the assistant director for the MS in Applied Economics Program at Hopkins, spoke at a webinar Nov. 11 on “COVID-19 Deaths–A Look at U.S. Data.” She meticulously detailed the facts she used and the conclusion she reached. The hour-long webinar can be viewed here.

Briand showed where and how to access the data from the Centers for Disease Control (CDC). She discussed the annual patterns of deaths in the United States and the reported number of COVID-19 deaths in relation to those annual patterns from 2014 through September, 2020.

Every year, there are recurring peaks and lows in death numbers that apply to all causes of death. She said that because of the emphasis on COVID-19, other major causes of death are being understated. She showed the percentage of total deaths by age categories and how there was no significant increase in deaths of older Americans.

The number of heart attacks and cancer, the first and second leading causes of death in the U.S., both dropped below levels expected based on previous patterns. Where all causes of death have historically spiked at the same time, for the three weeks in April when COVID-19 deaths were shown as a major spike, all other causes of death numbers dropped below the expected number in the same proportion that COVID-19 deaths increased.

Briand concluded the program with a call to the attendees to contact her if they have any ideas about why the numbers are so unusual. She urged fact checks to replicate and expand data analysis using other variables and time-series data analysis and discussed a “bottom-up approach to evidence seeking” at the state, county, township, hospital levels. She did not comment beyond explaining the methodology and showing the patterns in the CDC records since 2014, and how the COVID numbers don’t follow those patterns.

Anyone watching the presentation won’t find answers in Virginia about whether the Commonwealth’s numbers are accurate. Virginia death statistics and causes are published two or more years after the fact, the most recent is for 2017, so there is no way yet to look at changes in the total death numbers compared to prior years.

Only 6% of COVID-19 deaths have no other underlying conditions. So, even if COVID-19 is accelerating, the number of deaths that would have occurred due to heart disease or cancer, the death totals over time would not be markedly increased. Remember the September interview where Tim Powell of VDH’s Office of Epidemiology said, “If it’s on the death certificate, it’s counted. For instance, a cancer patient in hospice could count as a COVID-19 death if they also have the virus.”

So, we’re left to wonder how many COVID-19 death reports are for patients who died with COVID-19, not of COVID-19. It may be 2023 before we can find out, leaving our children falling behind with virtual classes and businesses being brought to financial ruin by COVID-19 mandates.

COVID-19 is a nasty disease, but the truth may be its worst casualty.


Share this article


ADVERTISEMENT

(comments below)


ADVERTISEMENT

(comments below)


Comments

42 responses to “Where Have All the Heart Attacks Gone?”

  1. Steve Haner Avatar
    Steve Haner

    I don’t really want to invest an hour in this and watch that. I was just on the CDC website and it reports 112% of the normal number of deaths during the pandemic period. Individual weeks early on were 140%, but that’s way down now. Is she actually claiming there are no excess deaths? I’ve always felt deaths “with” and “of” were intermingled. So that’s not news.

    I bet non-COVID deaths also often have multiple conditions listed. Certainly flu and pneumonia will.

    Interestingly, CDC shows some states are having fewer deaths than normal. WVA and NC and Puerto Rico. But it is showing VA deaths as more than would be expected, 113%. And several other states are well over the US figure of 112%.

    Is a 12% spike in deaths sufficient cause for the restrictions? Would it have been higher without them? Fair to debate. But I dispute that COVID has had no impact.

  2. Hamilton Lombard Avatar
    Hamilton Lombard

    Death data is extremely complex. But on the state level you can see preliminary death data for this year and last year in the CDC’s Weekly Counts of Deaths by State and Select Causes, 2019-2020

  3. So the analysis PROVES beyond a doubt that Covid-19 cures heart disease and cancer!

  4. Nancy_Naive Avatar
    Nancy_Naive

    “Hadn’t been for Grayson, I’d have been in Tennessee.”
    So, I guess Grayson done him in.

  5. Steve Haner: No. She is not saying there are no excess deaths. She’s questioning the initial huge spike for the first reports in April and the subsequent reductions in other causes of death in September that’s about the same increase shown for COVID-19.

    I think the importance of Briand’s study is in reminding us we have to remain aware the COVID-19 numbers are estimates from incomplete data using algorithms and more information is needed for solid conclusions.
    The CDC’s disclaimers are not picked up when the COVID-19 numbers are used. Here is one example.

    CDC: “Provisional death counts are weighted to account for incomplete data. However, data for the most recent week(s) are still likely to be incomplete. Weights are based on completeness of provisional data in prior years, but the timeliness of data may have changed in 2020 relative to prior years, so the resulting weighted estimates may be too high in some jurisdictions and too low in others.”

    And here is another example. In one CDC report, they said: “Overall, an estimated 299,028 excess deaths occurred from late January through October 3, 2020, with 198,081 (66%) excess deaths attributed to COVID-19. The largest percentage increases were seen among adults aged 25–44 years and among Hispanic or Latino persons.” But that 198,000 has morphed into 265,000 a month later—without the disclaimers in the report like these:.

    “The findings in this are subject to at least five limitations.
    • First, the weighting of provisional NVSS mortality data might not fully account for reporting lags, particularly in recent weeks. Estimated numbers of deaths in the most recent weeks are likely underestimated and will increase as more data become available.
    • Second, there is uncertainty associated with the models used to generate the expected numbers of deaths in a given week. A range of values for excess death estimates is provided elsewhere (7), but these ranges might not reflect all of the sources of uncertainty, such as the completeness of provisional data.
    • Third, different methods or models for estimating the expected numbers of deaths might lead to different results. Estimates of the number or percentage of deaths above average levels by race/ethnicity and age reported here might not sum to the total numbers of excess deaths reported elsewhere, which might have been estimated using different methodologies.

    • Fourth, using the average numbers of deaths from past years might underestimate the total expected numbers because of population growth or aging, or because of increasing trends in certain causes such as drug overdose mortality.

    • Finally, estimates of excess deaths attributed to COVID-19 might underestimate the actual number directly attributable to COVID-19, because deaths from other causes might represent misclassified COVID-19–related deaths or deaths indirectly caused by the pandemic. Specifically, deaths from circulatory diseases, Alzheimer disease and dementia, and respiratory diseases have increased in 2020 relative to past years (7), and it is unclear to what extent these represent misclassified COVID-19 deaths or deaths indirectly related to the pandemic (e.g., because of disruptions in health care access or utilization).”

    1. Steve Haner Avatar
      Steve Haner

      So what? That is the question that matters. I understand the data is preliminary and subject to update, but the issue is some see that and argue this is all a hoax. I know that’s not your position, but Publius in that other chain was going there. From the beginning I’ve found myself somewhere between the “this a hoax to create a government takeover” position and the “this is the deadliest plague imaginable” BS.

      If I get this and croak the death certificate will clearly mention cardiovascular disease as a pre-existing condition. But absent COVID that is totally under control and it would the COVID that caused the death.

      1. covidexpert Avatar
        covidexpert

        Death certificate information should be filled out based on the doctor’s opinion of what likely was the significant factor that caused a person’s death. If your cardiovascular disease was deemed to be under control when you died, and if you had Covid, then Covid is what essentially killed you. You might have been able to live for many years if you didn’t contract Covid. But if you were in poor health to begin with, the doctor could state that Covid was not the main cause. For a fuller explanation, see:

        https://www.latimes.com/business/story/2020-10-22/death-certificates-covid-coronavirus-infections

        Note that local public health departments have created their own rules. The CDC doesn’t have the final say.

    2. covidexpert Avatar
      covidexpert

      First, she did deny that excess deaths occurred, according to the original article. “All of this points to no evidence that COVID-19 created any excess deaths. Total death numbers are not above normal death numbers. We found no evidence to the contrary,” Briand concluded.

      Was this quote correct? I have not watched the video. This is one of the reasons why the student newsletter pulled the article. It realized that what it stated was incorrect. There was indeed plenty of proof of excess deaths in the US, and it’s still occurring. European countries discovered the same thing. So whatever she is arguing, it has to apply to these other countries also. Is she the only person in the whole world with this view point?

      Where are her graphs and tables and methodology? Has she looked at information at state level?

      Given the many claims by scientists have made on Covid, that turned out to be wrong, I would only trust a peer reviewed article. Or at least has written her beliefs in a well researched public paper.

      1. “…It seems she purposely chose only to look at the death rates at the end of first wave.”

        That’s not accurate. It’s not just about the first wave. There are graphs covering the causes of death Jan 11 2014 to Sept 26 2020, that show the increases in heart disease and cancer deaths you refer to.

        Her main emphasis is on the lower than historically expected numbers for heart disease and cancer deaths later in the year.

        The article shows the graph with the highlighted details for later in 2020, while the chart is for the April numbers.

        The video has several other images with detail insets explaining her points.

        Her study was on the CDC information. State information is simply not available on current year causes of death for most states.

        https://www.baconsrebellion.com/app/uploads/2020/11/deaths-by-week.jpg

        https://www.baconsrebellion.com/app/uploads/2020/11/deaths-by-week2.jpg

  6. Steve Haner Avatar
    Steve Haner

    I don’t really want to invest an hour in this and watch that. I was just on the CDC website and it reports 112% of the normal number of deaths during the pandemic period. Individual weeks early on were 140%, but that’s way down now. Is she actually claiming there are no excess deaths? I’ve always felt deaths “with” and “of” were intermingled. So that’s not news.

    I bet non-COVID deaths also often have multiple conditions listed. Certainly flu and pneumonia will.

    Interestingly, CDC shows some states are having fewer deaths than normal. WVA and NC and Puerto Rico. But it is showing VA deaths as more than would be expected, 113%. And several other states are well over the US figure of 112%.

    Is a 12% spike in deaths sufficient cause for the restrictions? Would it have been higher without them? Fair to debate. But I dispute that COVID has had no impact.

  7. Hamilton Lombard Avatar
    Hamilton Lombard

    Death data is extremely complex. But on the state level you can see preliminary death data for this year and last year in the CDC’s Weekly Counts of Deaths by State and Select Causes, 2019-2020

  8. So the analysis PROVES beyond a doubt that Covid-19 cures heart disease and cancer!

  9. No…not saying a hoax. I said it was a psy-op to invoke unnecessary fear. We have seasonal flu and deaths every year. Were the shutdowns necessary? I think they will be proved counterproductive. There has been so much about this that is just wrong. The politicization of the HCQ cocktail, the daily “case” totals, the arbitrariness of essential/nonessential designations, the suspension of the First Amendment. It seems more akin to the Salem witch trials. This risk aversion decision-making is ruining our society. I find the Henrico snow day policy ridiculous. My favorite was the time they predicted inches of snow and called it off the day before – the system blew North about 45 miles and no snow in sight…anywhere! An inch of snow and we must cancel! And all the kids go to the mall… “But if we save one life…” Then don’t drive, don’t ski, don’t swim, don’t surf, don’t do construction, etc…

    1. Steve Haner Avatar
      Steve Haner

      Well, you linked to an article that in the headline claimed “no excess deaths,” which I still reject as false and which is contradicted by CDC. I can understand why JHU considered that abusing its data. But I certainly agree the fear porn has been over the top, and while I thought it would go away after November 3, no such luck.

      The same game is underway with regard to “catastrophic climate change,” with far less basis in truth and far more economic devastation in store.

      1. Nancy_Naive Avatar
        Nancy_Naive

        It’s not porn, it’s art. You are one fellow I wouldn’t want in my foxhole. Again, with what we know about viruses and what we don’t know about this one, anyone who thinks when it’s gone, it’s over, is whistling past the graveyard.

        https://www.nature.com/articles/s41413-020-0084-5

        1. Steve Haner Avatar
          Steve Haner

          Oh, I agree, this may remain endemic, which is why I’m worried about the fools saying we can’t open the economy or schools until it is all gone. Happy to leave you in your own foxhole.

          1. Nancy_Naive Avatar
            Nancy_Naive

            May remain? It will. There are a full 1/3 of the people who believe it was a hoax, and would disappear on Nov 3. Oddly, the same people who deny anthropogenic climate change. Funny, they all voted for the same guy too. Yeah, endemic. Could be genetic too. Too much Neanderthal in the gene pool.

            Now climate change doesn’t bother me. Won’t happen to me, nor you. No harm in denying science there.

      2. Nancy_Naive Avatar
        Nancy_Naive

        Science does correct itself and that’s the reason why science is such a glorious thing for our species. -Nigel Calder, science writer (2 Dec 1931-2014)

        The unfortunate thing about denying science, or even too healthy of a dose of skepticism, is breaking the inertia to self-correct. Polar caps are going. Are the models correct? Meh. One thing is certain, the trends are supported. Models that do not account for anthropogenic CO2 under predict the measured trend. Those that attempt to account for it, over predict. But the measurements are still there.

  10. Nancy_Naive Avatar
    Nancy_Naive

    “Hadn’t been for Grayson, I’d have been in Tennessee.”
    So, I guess Grayson done him in.

  11. Steve Haner: No. She is not saying there are no excess deaths. She’s questioning the initial huge spike for the first reports in April and the subsequent reductions in other causes of death in September that’s about the same increase shown for COVID-19.

    I think the importance of Briand’s study is in reminding us we have to remain aware the COVID-19 numbers are estimates from incomplete data using algorithms and more information is needed for solid conclusions.
    The CDC’s disclaimers are not picked up when the COVID-19 numbers are used. Here is one example.

    CDC: “Provisional death counts are weighted to account for incomplete data. However, data for the most recent week(s) are still likely to be incomplete. Weights are based on completeness of provisional data in prior years, but the timeliness of data may have changed in 2020 relative to prior years, so the resulting weighted estimates may be too high in some jurisdictions and too low in others.”

    And here is another example. In one CDC report, they said: “Overall, an estimated 299,028 excess deaths occurred from late January through October 3, 2020, with 198,081 (66%) excess deaths attributed to COVID-19. The largest percentage increases were seen among adults aged 25–44 years and among Hispanic or Latino persons.” But that 198,000 has morphed into 265,000 a month later—without the disclaimers in the report like these:.

    “The findings in this are subject to at least five limitations.
    • First, the weighting of provisional NVSS mortality data might not fully account for reporting lags, particularly in recent weeks. Estimated numbers of deaths in the most recent weeks are likely underestimated and will increase as more data become available.
    • Second, there is uncertainty associated with the models used to generate the expected numbers of deaths in a given week. A range of values for excess death estimates is provided elsewhere (7), but these ranges might not reflect all of the sources of uncertainty, such as the completeness of provisional data.
    • Third, different methods or models for estimating the expected numbers of deaths might lead to different results. Estimates of the number or percentage of deaths above average levels by race/ethnicity and age reported here might not sum to the total numbers of excess deaths reported elsewhere, which might have been estimated using different methodologies.

    • Fourth, using the average numbers of deaths from past years might underestimate the total expected numbers because of population growth or aging, or because of increasing trends in certain causes such as drug overdose mortality.

    • Finally, estimates of excess deaths attributed to COVID-19 might underestimate the actual number directly attributable to COVID-19, because deaths from other causes might represent misclassified COVID-19–related deaths or deaths indirectly caused by the pandemic. Specifically, deaths from circulatory diseases, Alzheimer disease and dementia, and respiratory diseases have increased in 2020 relative to past years (7), and it is unclear to what extent these represent misclassified COVID-19 deaths or deaths indirectly related to the pandemic (e.g., because of disruptions in health care access or utilization).”

    1. Steve Haner Avatar
      Steve Haner

      So what? That is the question that matters. I understand the data is preliminary and subject to update, but the issue is some see that and argue this is all a hoax. I know that’s not your position, but Publius in that other chain was going there. From the beginning I’ve found myself somewhere between the “this a hoax to create a government takeover” position and the “this is the deadliest plague imaginable” BS.

      If I get this and croak the death certificate will clearly mention cardiovascular disease as a pre-existing condition. But absent COVID that is totally under control and it would the COVID that caused the death.

      1. covidexpert Avatar
        covidexpert

        Death certificate information should be filled out based on the doctor’s opinion of what likely was the significant factor that caused a person’s death. If your cardiovascular disease was deemed to be under control when you died, and if you had Covid, then Covid is what essentially killed you. You might have been able to live for many years if you didn’t contract Covid. But if you were in poor health to begin with, the doctor could state that Covid was not the main cause. For a fuller explanation, see:

        https://www.latimes.com/business/story/2020-10-22/death-certificates-covid-coronavirus-infections

        Note that local public health departments have created their own rules. The CDC doesn’t have the final say.

    2. covidexpert Avatar
      covidexpert

      First, she did deny that excess deaths occurred, according to the original article. “All of this points to no evidence that COVID-19 created any excess deaths. Total death numbers are not above normal death numbers. We found no evidence to the contrary,” Briand concluded.

      Was this quote correct? I have not watched the video. This is one of the reasons why the student newsletter pulled the article. It realized that what it stated was incorrect. There was indeed plenty of proof of excess deaths in the US, and it’s still occurring. European countries discovered the same thing. So whatever she is arguing, it has to apply to these other countries also. Is she the only person in the whole world with this view point?

      Where are her graphs and tables and methodology? Has she looked at information at state level?

      Given the many claims by scientists have made on Covid, that turned out to be wrong, I would only trust a peer reviewed article. Or at least has written her beliefs in a well researched public paper.

      1. “…It seems she purposely chose only to look at the death rates at the end of first wave.”

        That’s not accurate. It’s not just about the first wave. There are graphs covering the causes of death Jan 11 2014 to Sept 26 2020, that show the increases in heart disease and cancer deaths you refer to.

        Her main emphasis is on the lower than historically expected numbers for heart disease and cancer deaths later in the year.

        The article shows the graph with the highlighted details for later in 2020, while the chart is for the April numbers.

        The video has several other images with detail insets explaining her points.

        Her study was on the CDC information. State information is simply not available on current year causes of death for most states.

        https://www.baconsrebellion.com/app/uploads/2020/11/deaths-by-week.jpg

        https://www.baconsrebellion.com/app/uploads/2020/11/deaths-by-week2.jpg

  12. No…not saying a hoax. I said it was a psy-op to invoke unnecessary fear. We have seasonal flu and deaths every year. Were the shutdowns necessary? I think they will be proved counterproductive. There has been so much about this that is just wrong. The politicization of the HCQ cocktail, the daily “case” totals, the arbitrariness of essential/nonessential designations, the suspension of the First Amendment. It seems more akin to the Salem witch trials. This risk aversion decision-making is ruining our society. I find the Henrico snow day policy ridiculous. My favorite was the time they predicted inches of snow and called it off the day before – the system blew North about 45 miles and no snow in sight…anywhere! An inch of snow and we must cancel! And all the kids go to the mall… “But if we save one life…” Then don’t drive, don’t ski, don’t swim, don’t surf, don’t do construction, etc…

    1. Steve Haner Avatar
      Steve Haner

      Well, you linked to an article that in the headline claimed “no excess deaths,” which I still reject as false and which is contradicted by CDC. I can understand why JHU considered that abusing its data. But I certainly agree the fear porn has been over the top, and while I thought it would go away after November 3, no such luck.

      The same game is underway with regard to “catastrophic climate change,” with far less basis in truth and far more economic devastation in store.

      1. Nancy_Naive Avatar
        Nancy_Naive

        It’s not porn, it’s art. You are one fellow I wouldn’t want in my foxhole. Again, with what we know about viruses and what we don’t know about this one, anyone who thinks when it’s gone, it’s over, is whistling past the graveyard.

        https://www.nature.com/articles/s41413-020-0084-5

        1. Steve Haner Avatar
          Steve Haner

          Oh, I agree, this may remain endemic, which is why I’m worried about the fools saying we can’t open the economy or schools until it is all gone. Happy to leave you in your own foxhole.

          1. Nancy_Naive Avatar
            Nancy_Naive

            May remain? It will. There are a full 1/3 of the people who believe it was a hoax, and would disappear on Nov 3. Oddly, the same people who deny anthropogenic climate change. Funny, they all voted for the same guy too. Yeah, endemic. Could be genetic too. Too much Neanderthal in the gene pool.

            Now climate change doesn’t bother me. Won’t happen to me, nor you. No harm in denying science there.

      2. Nancy_Naive Avatar
        Nancy_Naive

        Science does correct itself and that’s the reason why science is such a glorious thing for our species. -Nigel Calder, science writer (2 Dec 1931-2014)

        The unfortunate thing about denying science, or even too healthy of a dose of skepticism, is breaking the inertia to self-correct. Polar caps are going. Are the models correct? Meh. One thing is certain, the trends are supported. Models that do not account for anthropogenic CO2 under predict the measured trend. Those that attempt to account for it, over predict. But the measurements are still there.

  13. covidexpert Avatar
    covidexpert

    The flaw in Brand’s logic, is that she chose to only display the “three weeks in April when COVID-19 deaths were shown as a major spike.” But did she mention display what happened before then? Starting March 1, death rates rose for heart attacks, diabetes, strokes, and Alzehimer’s, that were not categorized as Covid deaths. See this JAMA article:

    https://jamanetwork.com/journals/jama/fullarticle/2768086

    “Between March 1, 2020, and April 25, 2020, a total of 505 059 deaths were reported in the US; 87 001 (95% CI, 86 578-87 423) were excess deaths, of which 56 246 (65%) were attributed to COVID-19. In 14 states, more than 50% of excess deaths were attributed to underlying causes other than COVID-19; these included California (55% of excess deaths) and Texas (64% of excess deaths) . The 5 states with the most COVID-19 deaths experienced large proportional increases in deaths due to nonrespiratory underlying causes, including diabetes (96%), heart diseases (89%), Alzheimer disease (64%), and cerebrovascular diseases (35%) . New York City experienced the largest increases in nonrespiratory deaths, notably those due to heart disease (398%) and diabetes (356%).”

    So death rates for multiple causes were rising during that time period. But for the time period of 4/11 and 4/25, which Brand display on her charts, this was the end of the first wave, when obviously death rates for all causes would be decreasing.

    https://web.archive.org/web/20201126163323/https://www.jhunewsletter.com/article/2020/11/a-closer-look-at-u-s-deaths-due-to-covid-19

    It’s only by looking at the data from the previous weeks, do we see the increase in deaths from other causes, which she claimed should have happened. It seems she purposely chose only to look at the death rates at the end of first wave.

    If you want to know what might influenced her to create her paper and present it on Youtube, see this letter she wrote in July to a Wyoming newspaper:

    https://kemmerergazette.com/article/letter-to-the-editor-without-risk-that-are-no-rewards

    1. “…It seems she purposely chose only to look at the death rates at the end of first wave.”

      That’s not accurate. It’s not just about the first wave. There are graphs and discussion covering the causes of death Jan 11 2014 to Sept 26 2020, that show the increases in heart disease and cancer deaths you refer to, as well as later in the year where her main emphasis is on the lower than historically expected numbers for heart disease and cancer deaths later in the year.

      The article only shows the graph with the highlighted details for later in 2020, and the chart for the April numbers, not everything she presents.

      The video has several other images with detail insets where she explains her methodology, step by step.

      Her study was on the CDC information. State information is simply not available on current year causes of death for most states.

  14. covidexpert Avatar
    covidexpert

    The flaw in Brand’s logic, is that she chose to only display the “three weeks in April when COVID-19 deaths were shown as a major spike.” But did she mention display what happened before then? Starting March 1, death rates rose for heart attacks, diabetes, strokes, and Alzehimer’s, that were not categorized as Covid deaths. See this JAMA article:

    https://jamanetwork.com/journals/jama/fullarticle/2768086

    “Between March 1, 2020, and April 25, 2020, a total of 505 059 deaths were reported in the US; 87 001 (95% CI, 86 578-87 423) were excess deaths, of which 56 246 (65%) were attributed to COVID-19. In 14 states, more than 50% of excess deaths were attributed to underlying causes other than COVID-19; these included California (55% of excess deaths) and Texas (64% of excess deaths) . The 5 states with the most COVID-19 deaths experienced large proportional increases in deaths due to nonrespiratory underlying causes, including diabetes (96%), heart diseases (89%), Alzheimer disease (64%), and cerebrovascular diseases (35%) . New York City experienced the largest increases in nonrespiratory deaths, notably those due to heart disease (398%) and diabetes (356%).”

    So death rates for multiple causes were rising during that time period. But for the time period of 4/11 and 4/25, which Brand display on her charts, this was the end of the first wave, when obviously death rates for all causes would be decreasing.

    https://web.archive.org/web/20201126163323/https://www.jhunewsletter.com/article/2020/11/a-closer-look-at-u-s-deaths-due-to-covid-19

    It’s only by looking at the data from the previous weeks, do we see the increase in deaths from other causes, which she claimed should have happened. It seems she purposely chose only to look at the death rates at the end of first wave.

    If you want to know what might influenced her to create her paper and present it on Youtube, see this letter she wrote in July to a Wyoming newspaper:

    https://kemmerergazette.com/article/letter-to-the-editor-without-risk-that-are-no-rewards

    1. “…It seems she purposely chose only to look at the death rates at the end of first wave.”

      That’s not accurate. It’s not just about the first wave. There are graphs and discussion covering the causes of death Jan 11 2014 to Sept 26 2020, that show the increases in heart disease and cancer deaths you refer to, as well as later in the year where her main emphasis is on the lower than historically expected numbers for heart disease and cancer deaths later in the year.

      The article only shows the graph with the highlighted details for later in 2020, and the chart for the April numbers, not everything she presents.

      The video has several other images with detail insets where she explains her methodology, step by step.

      Her study was on the CDC information. State information is simply not available on current year causes of death for most states.

  15. djrippert Avatar

    My father passed away at the age of 85 in July 2013. The recorded cause of death was myocardial infarct (a heart attack). He did not die of a heart attack. He died of old age. The doctors could see it coming two days in advance. I have been told by my own doctor that myocardial infarct was often cited as the cause of death when nothing else was obvious. The rules for that have apparently changed. According to my doctor MI is no longer allowable as a “default diagnosis” for somebody who dies of what most would call old age.

    I wonder how accurate the cause of death notations are for geriatric patients.

    1. Probably less accurate than for younger decedents, but it depends on the doctor completing the certificate. Instead of MI, cardiac arrest would be the more logical expression of a natural cause like aging, and that would be acceptable to the CDC.

      The CDC instructions for completing the Cause-of-Death Section of the Death Certificate say, “The elderly decedent should have a clear and distinct etiological sequence for cause of death, if possible. Terms such as senescence, infirmity, old age, and advanced age have little value for public health or medical research. Age is recorded elsewhere on the certificate.” They go into more details, then offer over 90 processes that can be used.

    2. Nancy_Naive Avatar
      Nancy_Naive

      I would guess not very. Dad died at 82 of a bacterial infection but bladder cancer was the COD. The Air Force was hesitant to cite the fact that they infected him with E. coli when they catheterized him.

      Mom at 96 “complications of Alzheimer’s”. Same for the mother-in-law. Once you are confined with Alzheimer’s, it’s the COD no matter how long it takes.

  16. djrippert Avatar

    My father passed away at the age of 85 in July 2013. The recorded cause of death was myocardial infarct (a heart attack). He did not die of a heart attack. He died of old age. The doctors could see it coming two days in advance. I have been told by my own doctor that myocardial infarct was often cited as the cause of death when nothing else was obvious. The rules for that have apparently changed. According to my doctor MI is no longer allowable as a “default diagnosis” for somebody who dies of what most would call old age.

    I wonder how accurate the cause of death notations are for geriatric patients.

    1. Probably less accurate than for younger decedents, but it depends on the doctor completing the certificate. Instead of MI, cardiac arrest would be the more logical expression of a natural cause like aging, and that would be acceptable to the CDC.

      The CDC instructions for completing the Cause-of-Death Section of the Death Certificate say, “The elderly decedent should have a clear and distinct etiological sequence for cause of death, if possible. Terms such as senescence, infirmity, old age, and advanced age have little value for public health or medical research. Age is recorded elsewhere on the certificate.” They go into more details, then offer over 90 processes that can be used.

    2. Nancy_Naive Avatar
      Nancy_Naive

      I would guess not very. Dad died at 82 of a bacterial infection but bladder cancer was the COD. The Air Force was hesitant to cite the fact that they infected him with E. coli when they catheterized him.

      Mom at 96 “complications of Alzheimer’s”. Same for the mother-in-law. Once you are confined with Alzheimer’s, it’s the COD no matter how long it takes.

  17. Nancy_Naive Avatar
    Nancy_Naive

    I know it’s late…

    Wife: I know I’ve gained weight since the quarantine, but do I look fat?
    Husband: Well, you weren’t really skinny to start with.
    Cause of Death — Covid-19

  18. Nancy_Naive Avatar
    Nancy_Naive

    I know it’s late…

    Wife: I know I’ve gained weight since the quarantine, but do I look fat?
    Husband: Well, you weren’t really skinny to start with.
    Cause of Death — Covid-19

Leave a Reply