What Global Warming? A Century of Virginia Julys

Graphing every daily high temperature for July in Purcellville, VA, more than a century of daily readings up through last month. What global warming? Click for full view.

By Steve Haner

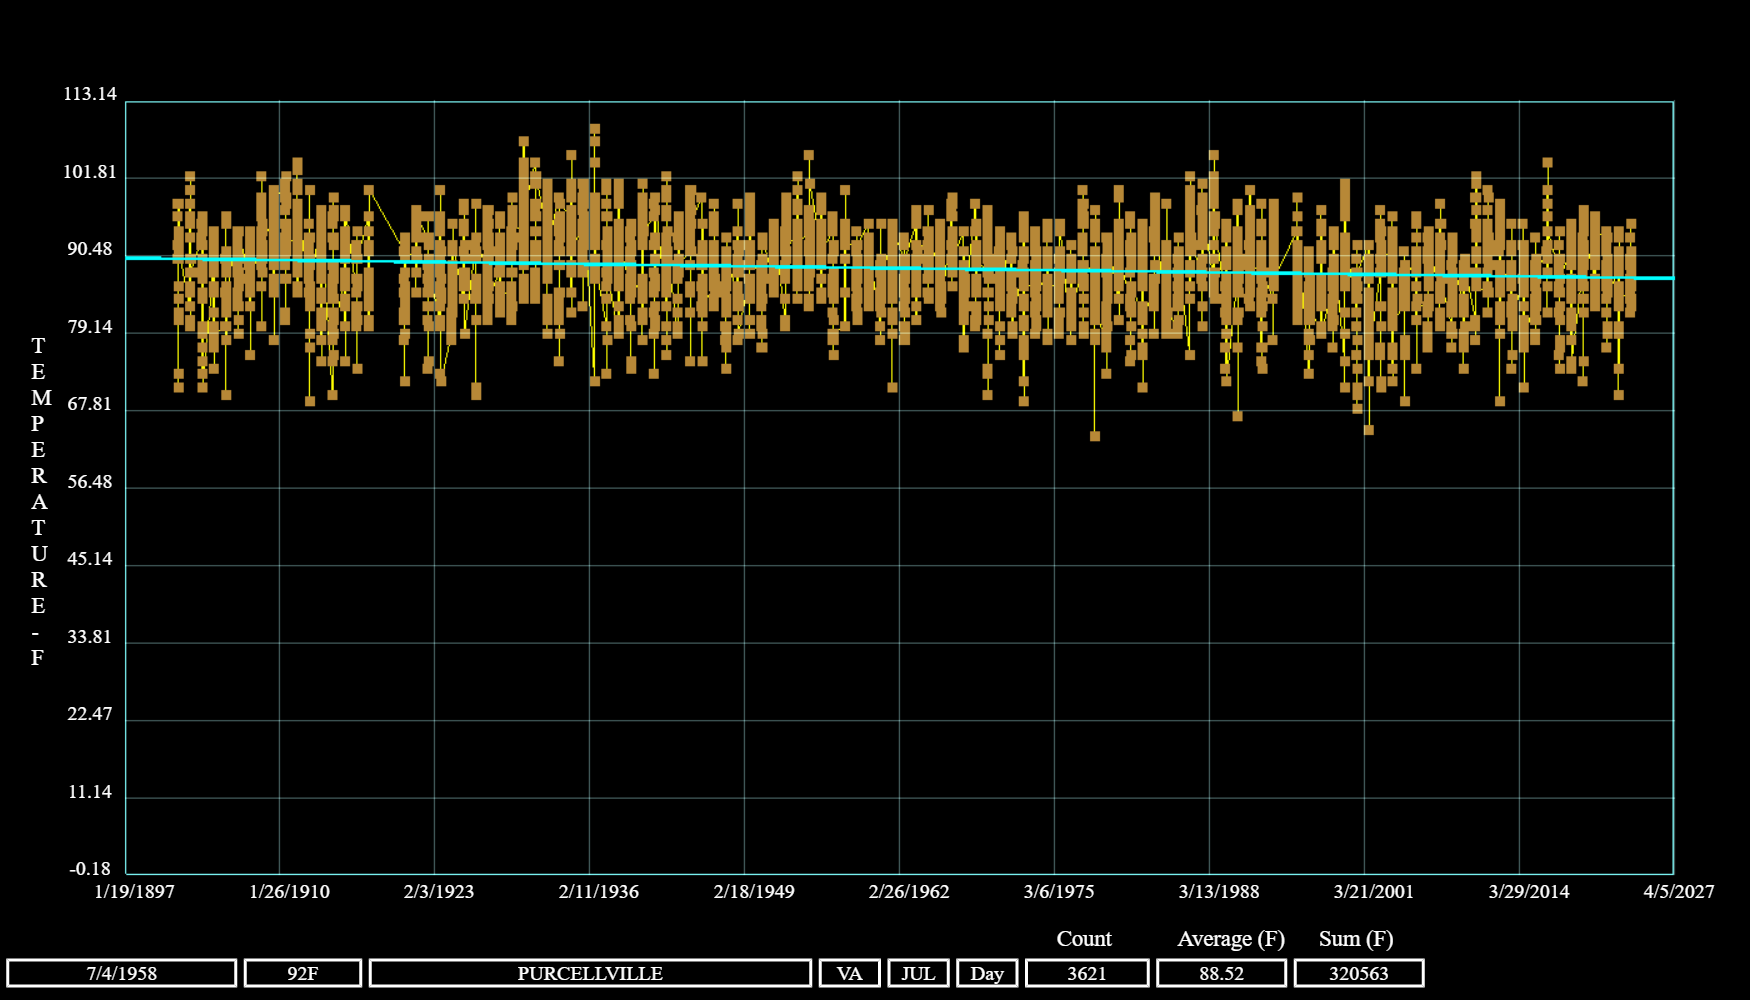
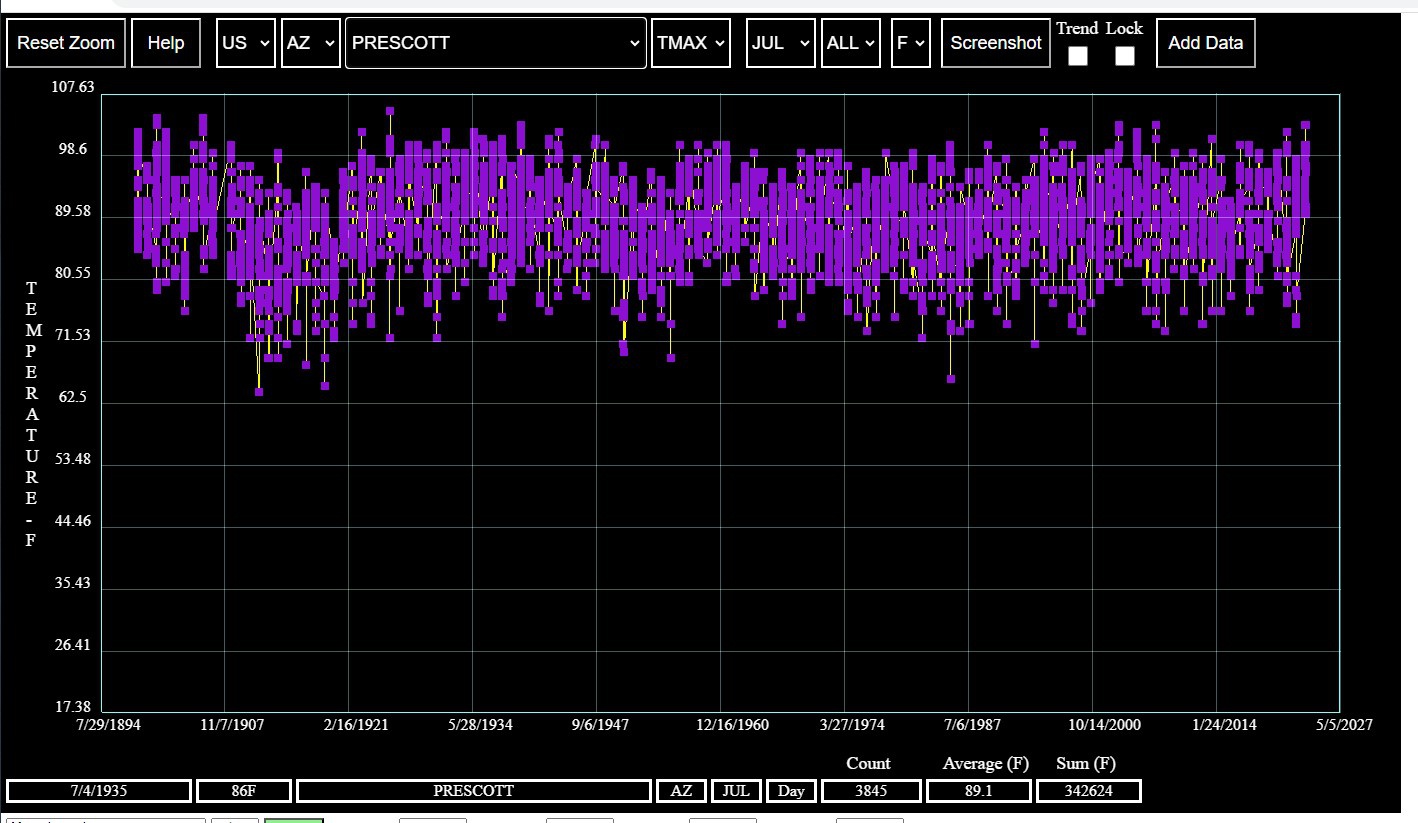
The constant media hysteria about July’s temperatures gets even harder to swallow when the long-term data are examined. For example, take a look at that graph above, which represents every daily high in July going back to the 19th Century at Purcellville in Loudoun County.

The Purcellville weather monitor is one of just 19 in Virginia with a long enough and reliable enough history to be included in National Oceanographic and Atmospheric Administration’s U.S. Historical Climatology Network. It is the closest Virginia USHCN monitor to the Washington metropolitan region, but like many of the selected monitors is not deep in an urban setting.

The graph itself was generated by a program developed by a regular writer on climate topics named Tony Heller, who spent much of his career doing research at the Los Alamos and Sandia national laboratories. This is mentioned because he will be attacked by the Bacon’s Rebellion usual suspects as not a real scientist or not a climate scientist. More of his background.

The graphing program can be balky (it could be my equipment or operator error), and you can try it yourself here under “Daily Station Temperatures.” You can select by state, and if you get the version that includes a box at the top marked “Annual Average,” that gives you a pulldown menu for the individual USHCN monitor stations in each state. The graph adds a trend line if you wish, which I included in my screenshots.

Running through the Virginia stations, the thought that comes to mind is, what climate change? What spike in temperatures? Most seem to be complete through all or most of last month. The media coverage has admitted that Virginia was not among the areas supposedly “broiling.” The state’s official NOAA summary claims a temperature rise of only 1.5 degrees Fahrenheit since 1900, almost 125 years.

Graphing the July daily highs at Norfolk Airport. Click for a larger view.
Graphing daily minimum temperature at Norfolk Airport during a century plus of Julys. Click for larger view.

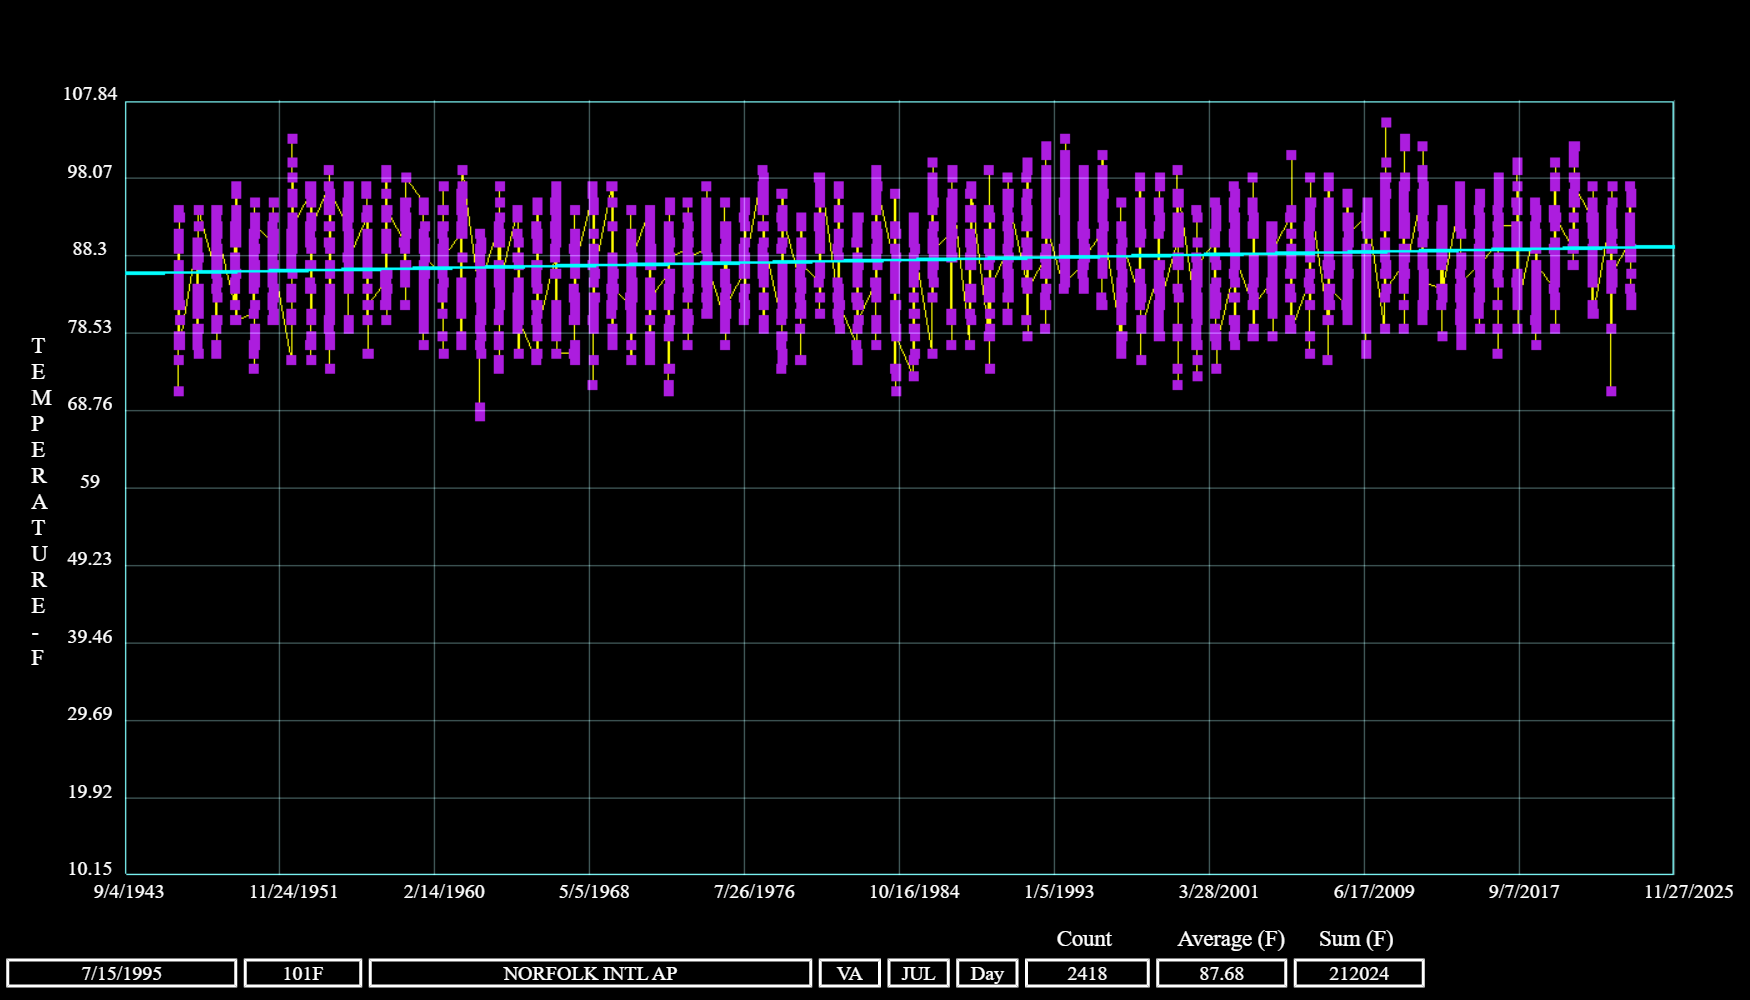
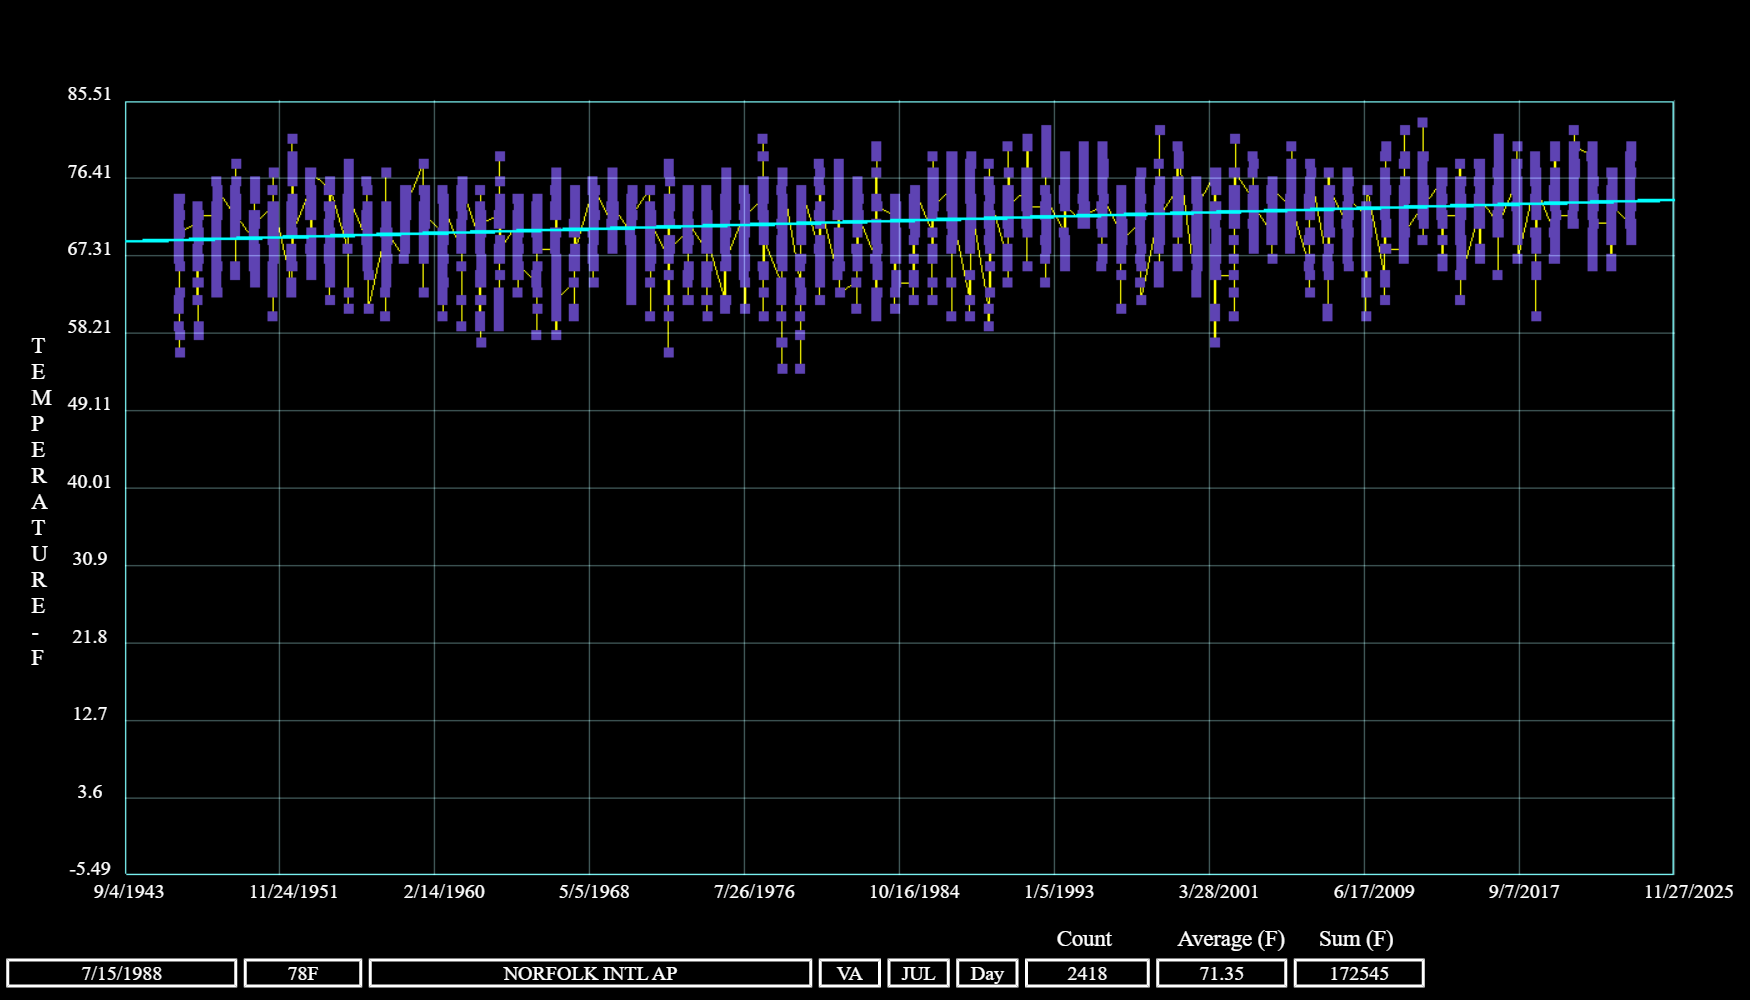
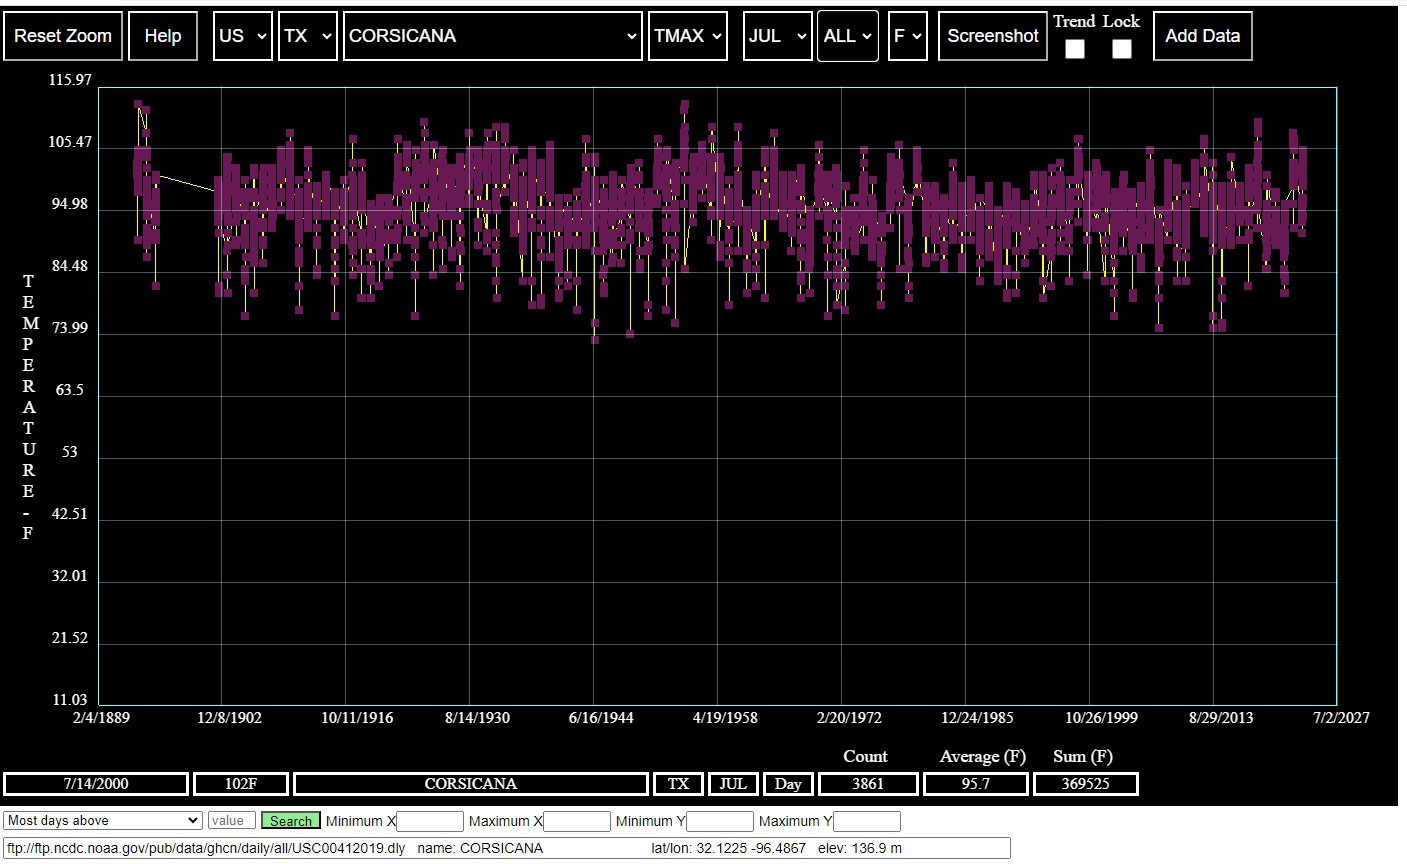
You can see a small tick upwards over the decades in some of the station graphs, such as the one above for Norfolk’s airport. But if there has been a rise in the average temperature, it is mainly due to slight increases in the daily low temperatures, a more noticeable trend for Norfolk. Some of that could be a heat island effect.

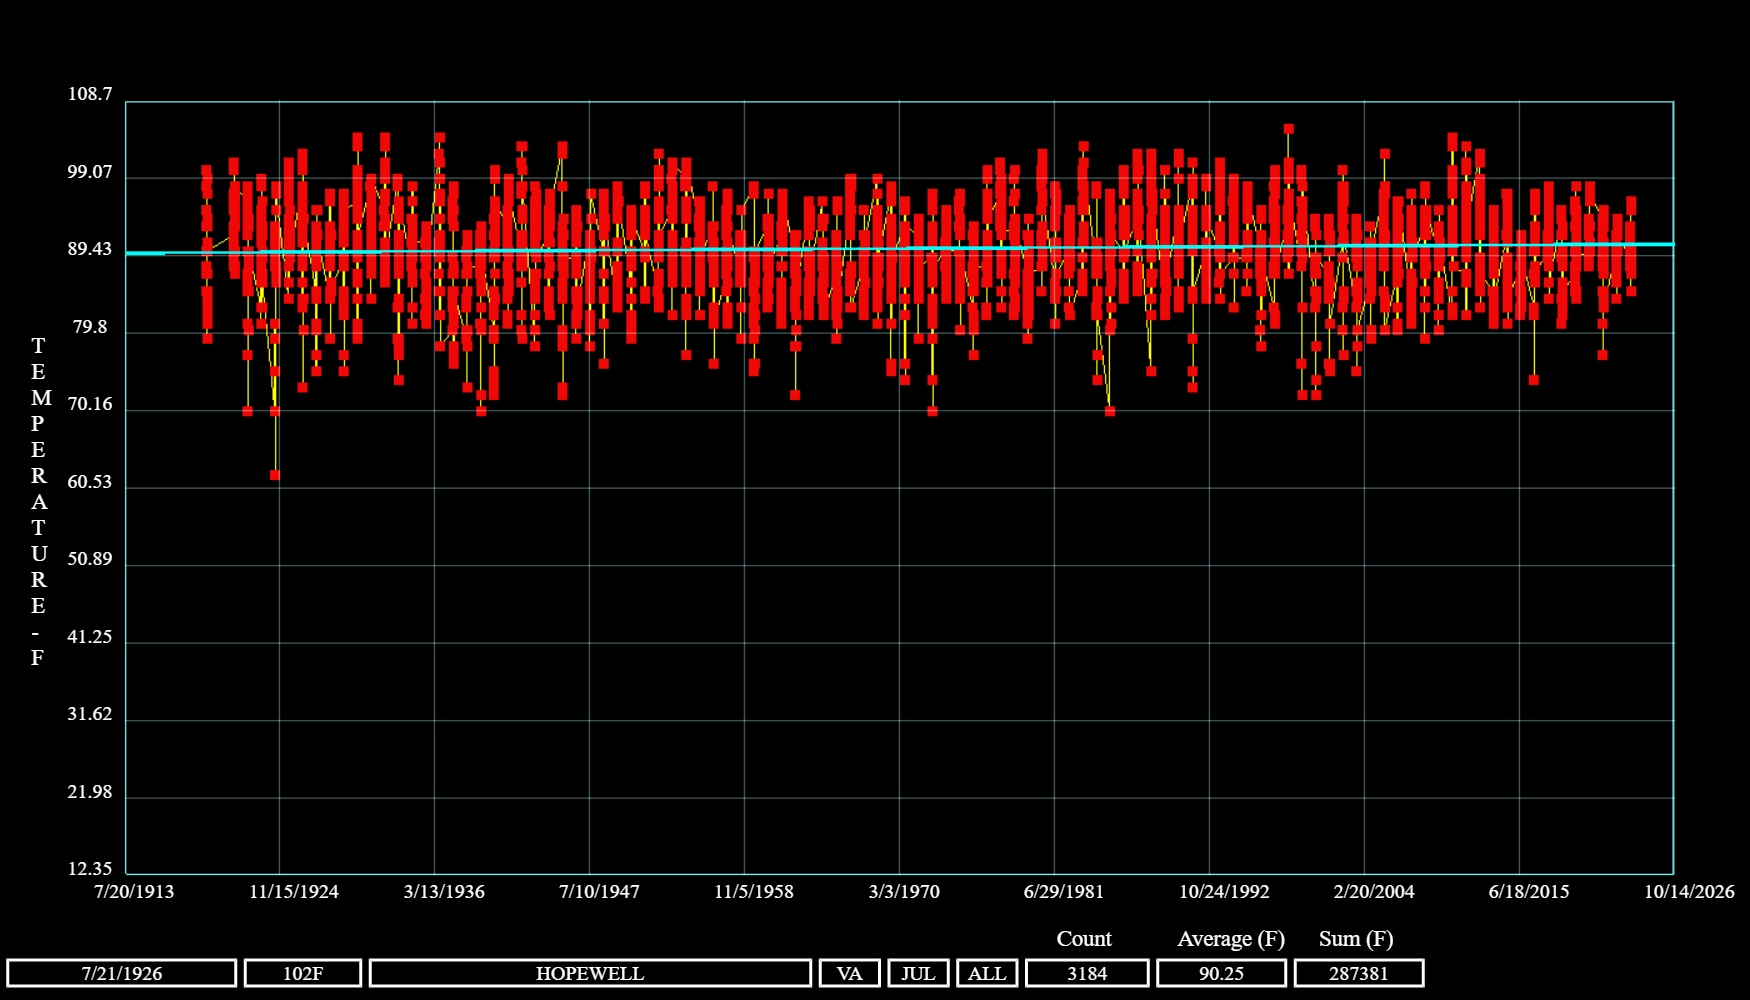
Hopewell is one of the stations closest to Richmond, and actually not far from Richmond’s airport, which is not a USHCN monitor. Hopewell July temps in the early 20th Century look no different than Hopewell in recent Julys. There is virtually no change in the daily highs and lows for the hottest month of the year.

Graphing dally highs for July at the Hopewell USHCN monitor. Click for larger view.

The same program will graph station by station data over time on rainfall and snowfall (don’t check for snow in July) and again, the eye sees little variation over the years.  If anything, rainfall may be edging up in places, but not substantially.

On the basis of this we are supposed to abandon all use of gasoline and diesel, get rid of our natural gas furnaces and stoves, and shut down perfectly viable electric generation plants? All the prophecies of imminent doom, famine, and death are based on these tiny (and in some places non-existent) changes in temperature and rainfall.

July 2023 on a worldwide basis was a hot month. Looking at some of the more reliable measurement methods, it may have reached a recent record. The difference from the previous high in 2016 is just a fraction of a degree. That was also an El Niño year. The satellite readings monitored by the University of Alabama-Huntsville start in 1979 and did show July 2023 with the largest anomaly from the mean for July measured by the satellites so far.

But media efforts to claim it was the hottest ever month in history, claiming comparisons to prior centuries with no such records, are nonsense.  The Climate Catastrophe Narrative is a religious doctrine, a matter of faith overcoming evidence. And like most organized religions, a priestly class has grown up claiming to know how to appease the angry weather gods. If we just give them the money, they will save us! But what are we being saved from?


Share this article


ADVERTISEMENT

(comments below)


ADVERTISEMENT

(comments below)


Comments

43 responses to “What Global Warming? A Century of Virginia Julys”

  1. There you go using Euro-centric logic and racist facts in this debate. The SPLC will be coming for you now — don’t be surprised if you’re included in its ‘Hate Group’ Map next month.

  2. James Kiser Avatar
    James Kiser

    The hottest temps recorded in the US were back in the 30’s. And that is an official chart from the US govt. Just a scam. same thing with the falsehood that green house gases trap heat, gases can’t trap heat other wise balloons would stay aloft forever and temps wouldn’t drop at night. Amazing how cold the desert gets once the sun goes down. Green houses are buildings with a roof and walls so there is another canard that gets punctured where is the roof and walls that is trapping all this heat ? Made up just like Biden.

    1. Stephen Haner Avatar
      Stephen Haner

      Right about the ’30s, but wrong on the physics of GHG. If they didn’t trap heat, there would be no life on earth at all. The desert would move nightly toward the kind of lows you see on the Moon. 🙂 In fact, one reason this is likely to be a hot year is the massive water vapor, the real GHG, ejected last year from a subsea Pacific volcano.

    2. Stephen Haner Avatar
      Stephen Haner

      Right about the ’30s, but wrong on the physics of GHG. If they didn’t trap heat, there would be no life on earth at all. The desert would move nightly toward the kind of lows you see on the Moon. 🙂 In fact, one reason this is likely to be a hot year is the massive water vapor, the real GHG, ejected last year from a subsea Pacific volcano. Volcanic activity is one of the variables that make those climate models so worthless.

  3. how_it_works Avatar
    how_it_works

    It seems like Virginia was hot enough to grow cotton 400 years ago, maybe?

    1. There’s not too much yellow fever or malaria being spread in Virginia these days, either…

      😉

  4. James Wyatt Whitehead Avatar
    James Wyatt Whitehead

    Greta is not inviting you to her birthday party.

  5. DJRippert Avatar
    DJRippert

    When John Kerry heads to a climate change meeting and his private plane lands somewhere with snow on the ground, conservatives mock Kerry while asking about “global warming”. Liberals are quick to retort that weather isn’t climate. But when there’s a hotter than usual July in some places, those same liberals insist that it proves global warming is real. In those cases (apparently) weather is climate.

  6. Stephen Haner Avatar
    Stephen Haner

    Let’s do one more, very rural and elevated Burke’s Garden, daily max and min for July.

    https://www.baconsrebellion.com/app/uploads/2023/08/BURKES-GARDEN-July-Max.png

    https://www.baconsrebellion.com/app/uploads/2023/08/BURKES-GARDEN-Min-July.png

    Nada, Zip, Zero. No temp change at all really.

  7. James Wyatt Whitehead Avatar
    James Wyatt Whitehead

    Greta is not inviting you to her birthday party.

  8. LesGabriel Avatar
    LesGabriel

    I wish I had noted the exact source and details of something I heard on the radio last week. The gist was that July 2023 was the hottest month in the past 100,000 years or some such peiod. I didn’t even know that they had invented thermometers that far back. Don’t tell me about tree rings or ice cores. I don’t think they are that precise.

    1. Not to mention that there was no such thing as “July” or “months” 100,000 years ago.

      But if a climate scientist said it, then it must be so. Because after all, the science is settled…

      😉

      1. Lefty665 Avatar

        You’re right, it was that Julius guy who invented July a couple of millennia ago. His great nephew Augie invented August which will be hot too. Blame hot weather on the Caesars. If it were not for those hot months the climate would be copacetic. 🙂

      2. LesGabriel Avatar
        LesGabriel

        Or possibly even an NPR reporter. What they say is “settled” also, I think.

          1. Lefty665 Avatar

            Scientific American got so woke several years ago that I’ve been threatening to drop my subscription. But lethargy rules and I haven’t gotten around to it.

            The SA article accusing docs of being racist because they routinely weigh weigh people, and black people weigh more is the piece that tripped my trigger. I guess the diseases caused by obesity are racist too, since they pick on black people more.

    2. Paul Sweet Avatar
      Paul Sweet

      They conveniently forget to mention that we were in the latest Ice Age 100,000 years ago. It ended about 18,000 years ago and temperatures (and sea levels) have been rising ever since.

    1. Stephen Haner Avatar
      Stephen Haner

      Love that place…always stop when heading up to Sedona.

      Nancy has confirmed he was looking at DFW, and I’m sure he got the numbers correct and I would expect to see that trend at a huge and growing metropolitan jet port. Any heat coming off those engines? The pavement and buildings? All part of the tricks the Climate Priests play to keep the dollars rolling in.

      Many expect this “OMG July Was The Apocalypse” media theme to be followed by Biden declaring a “climate emergency” to rival the COVID emergency. Boy I hope he does that before the elections here. Pretty please….

      1. “Love that place…always stop when heading up to Sedona.”

        Yes, it’s beautiful around there, at least to visit.

        Summers aren’t too bad, unless you are riding a motorcycle as I did when I lived out west. Riding a motorcycle when it’s 100 plus is like a massive convection oven.

  9. Nancy Naive Avatar
    Nancy Naive

    I realize y’all think the world of Virginia, but Virginia ain’t the world. In fact, as a percentage of the landmass, it scarcely exists.

    There is a word you need to learn, “aliasing”.

    Now, do Dallas.

    1. I couldn’t find a station in Dallas, but Corsicana is about 50 miles south:

      https://uploads.disquscdn.com/images/9cf27cae50aacc446dbc57550fe8347919873f5d376705b59fae82903354889d.jpg

      That one looks pretty flat, too – possibly is even slightly downward.

      1. Nancy Naive Avatar
        Nancy Naive

        I just sent Steve a MatLab plot of NOAA July average temperatures for Dallas 1922 to 2022. The rise per year was 0.019 degrees per year. He can post the figure I can’t. Of course, linear regression isn’t what we should be doing. If we suspect an acceleration then we should fit a quadratic.

        1. Point of clarification:

          The graph I posted is of July Maximum temperatures, not July Average temperatures. Mr. Haner was using Max & Min temps, so I stuck with Max for the sake of consistency.

        2. Stephen Haner Avatar
          Stephen Haner

          There is a reason few of the major urban centers are part of USHCN (urban heat effect), but curious which data point for Dallas was used. Agreed to the general point that you can find the warming pattern some places. I’m sure at DFW (or maybe Love) the pattern has been at least 2 degrees F over a century, which is what you noted. That’s why Purcellville is used and not Dulles Airport or Reagan. If the driver is the CO2, the signal should be everywhere.

          1. Nancy Naive Avatar
            Nancy Naive

            Assuming mixing, i.e., Caesar’s last breath. Like urban effects, vegetation effects exist too. I can assure you that I’d rather go to Busch Gardens than King’s Dominion in July. Perhaps we should use someplace not located near water, devoid of vegetation, and lacking in asphalt. Timbuktu? I wonder when/if the French bothered to establish a weather station?

            “The elephant is like a tree.”
            “No, it is like a snake.”
            “You’re both wrong. It is like a wall.”

            “Well, that was fun. Shall we chase the farmer’s wife?”

    2. Randy Huffman Avatar
      Randy Huffman

      So bring back fossil fuel power and drop the offshore windmills. With all the coal plants being built in China, a couple more won’t matter, let’s drop the cost as low as possible for Virginians, right?

    3. William O'Keefe Avatar
      William O’Keefe

      And, your point is?

      1. Nancy Naive Avatar
        Nancy Naive

        What’s your point in askin’?

        1. William O'Keefe Avatar
          William O’Keefe

          To try and understand what you are trying to say, if of course you even understand it.

          1. Nancy Naive Avatar
            Nancy Naive

            The author uses point data to draw conclusions over global trends, not to mention time scales.

            The temperature in the refrigerator will be a poor indicator of the temperature in a upper floor bedroom in a house fire.

          2. William O'Keefe Avatar
            William O’Keefe

            Actually, if you look at a chart of global temperature measurements over time, it looks very similar.

          3. Nancy Naive Avatar
            Nancy Naive

            Yes, they all look the same. So do a lot of things, cats and dogs for example.

  10. energyNOW_Fan Avatar
    energyNOW_Fan

    Judith Curry and co-authors have prepared a recent technical paper on the 2023 weather:
    https://judithcurry.com/2023/08/14/state-of-the-climate-summer-2023/

    Here in NoVA the summer has not been remarkable, but we seem to be on the lucky side of the jet stream.

  11. energyNOW_Fan Avatar
    energyNOW_Fan

    Judith Curry and co-authors have prepared a recent technical paper on the 2023 weather:
    https://judithcurry.com/2023/08/14/state-of-the-climate-summer-2023/

    Here in NoVA the summer has not been remarkable, but we seem to be on the lucky side of the jet stream.

  12. Nancy Naive Avatar
    Nancy Naive

    Here. Play with this. https://www.ncei.noaa.gov/access/monitoring/climate-at-a-glance/national/time-series/110/tavg/1/7/1895-2023?trend=true&trend_base=100&begtrendyear=1895&endtrendyear=2023

    You can play with the trend line over pieces of the data. What you might consider is first half, last half trends.

    I think later today, I’ll bomb Steve’s inbox with other charts.

    1. Stephen Haner Avatar
      Stephen Haner

      I’ve never said there is no warming. But it is smaller and slower than the media hype implies, and the models looking ahead are pure speculation. Growing GHG are at most part of the explanation for the minor change underway, and change is a constant anyway.

      1. Nancy Naive Avatar
        Nancy Naive

        I wish I knew what a climatic time scale was. It’s not 10 years. 50? Maybe like sun spots it’s 11?

        But for the lower 48, the trend was .14 deg per decade 1895 to 1965. It’s .39 degrees per decade for 1965 to 2023. That’s somewhat alarming. Not to me, mind you. It could be 2 degrees per decade for all I care. In 10 maybe 15 years if I’m lucky, I’ll be 100% in a climate controlled space anyway. Hell, ground temperature is pretty well controlled too.

        I don’t trust interpolation either, but I trust they have the trend right — up. It’s just going to get hotter and hotter.

  13. William O'Keefe Avatar
    William O’Keefe

    Most of the media and many readers have no idea of what temperature measures entail. In fact a global chart like your Purcellville chart looks similar. The calculated number is arrived at by calculating the average of a given month and then comparing it to the 30 year average which is why it is called an “anomaly” because of location, development, asphalt, vegetation, and other factors which distort the measurements. In addition, the type of devices used for land based measurements was changed some years ago.
    Satellite systems are the most accurate and so far show little reason for panic. Until science can distinguish natural variability from human effect, these monthly measurements will be used by media and alarmists to scare and to gain power so that their favorite hobby horse will get promoted.
    It’s much like H.L.Mencken’s observation that the “aim of practical politics is to keep the populace alarmed, and hence clamoring to be led to safety by menacing by and endless series of hobgoblins. Most of which are imaginary.”

    1. Nancy Naive Avatar
      Nancy Naive

      The problem? Some aren’t, and the trick is distinguishing between the some and the most, especially if the consequences for failure may be dire.

Leave a Reply