Virginia Public Schools and Learning Losses – Part 2 – Chronic Absenteeism

by James C. Sherlock

Woody Allen is quoted as saying that seventy percent of success in life is showing up. So it is with school.

Absenteeism is the most correctable scourge of Virginia public schools.

It is not the teachers’ job to get the kids there. But unexcused absenteeism is something other adults can fix pretty much at will. We have mandatory attendance in Virginia, and although the penalties can be significant,  the law is enforced only sporadically.

Some divisions enforce it. Some don’t. And there is a wide variation of enforcement in between.

Most will assume that in my data analysis project, the effects of reported chronic absenteeism in 2020-21 were generally reflected in:

  • 2021-22 SOL scores; and
  • three-year SOL learning losses of the school divisions between 2018-19 and 2021-22.

They are right.

Chronic absenteeism is a reported number that we must assume for these purposes is accurate, or accurate enough across 132 school divisions. I also note that reported absenteeism during virtual instruction in 2020-21 was in some cases gamed by students who turned off cameras at home after logging in, so the numbers of reported chronic absentees may undercount some of that phenomenon.

But so be it, the reported figures are bad enough.

We will examine here:

  • school divisions with high and low chronic absenteeism in 2020-21; vs.
  • the enforcement of truancy laws in those same divisions in that same year.

It turns out, no surprise, that nearly all school divisions reporting high chronic absenteeism in 2020-21 also had both:

  • low SOL scores in 2021-22; and
  • big learning losses over the three year period between 2018-19 and 2021-22.

We’ll look closer.

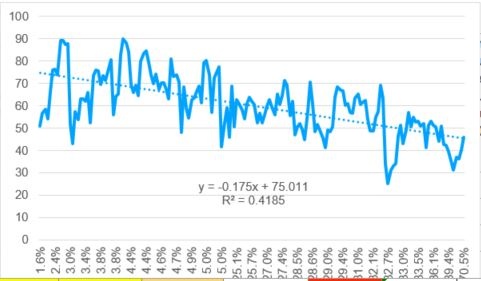
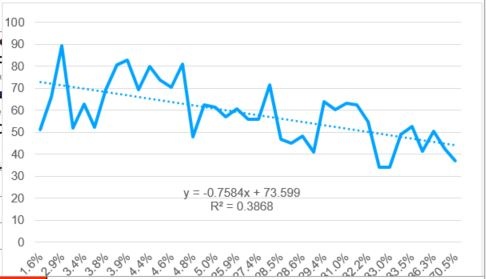
I have put together from my larger spreadsheet a subset showing both the divisions with the highest and lowest chronic absenteeism in 2020-21. I left in only the columns relevant to this particular sub-analysis. I was trying to  visualize

  • the relationships between chronic absenteeism and learning losses; and
  • the relationships between enforcement of the truancy laws and chronic absenteeism.

I removed the reading SOL results from this sub-assessment because that skill is more likely to be practiced at home than the other subjects tested. What remains are English writing, History and Social Science, Math and Science.

The spreadsheet customized for this report is sorted at the start by the divisions with the lowest reported chronic absenteeism (5% or less) on top and the worst (25% or greater) on the bottom.

Lowest reported chronic absenteeism. Those counties with the lowest reported chronic absenteeism (5% or less) in 2020-21 were, from the lowest:

Cumberland County (1.6%), West Point, Falls Church, Buckingham County, Southampton County, Russell County, Bland County, Fauquier County, Lexington, Rappahannock County, York County, New Kent County, Prince William County, Arlington County, Richmond County, Rockbridge County, Hanover County, Louisa County and Martinsville. 

Chronic absenteeism map AY 2020-21

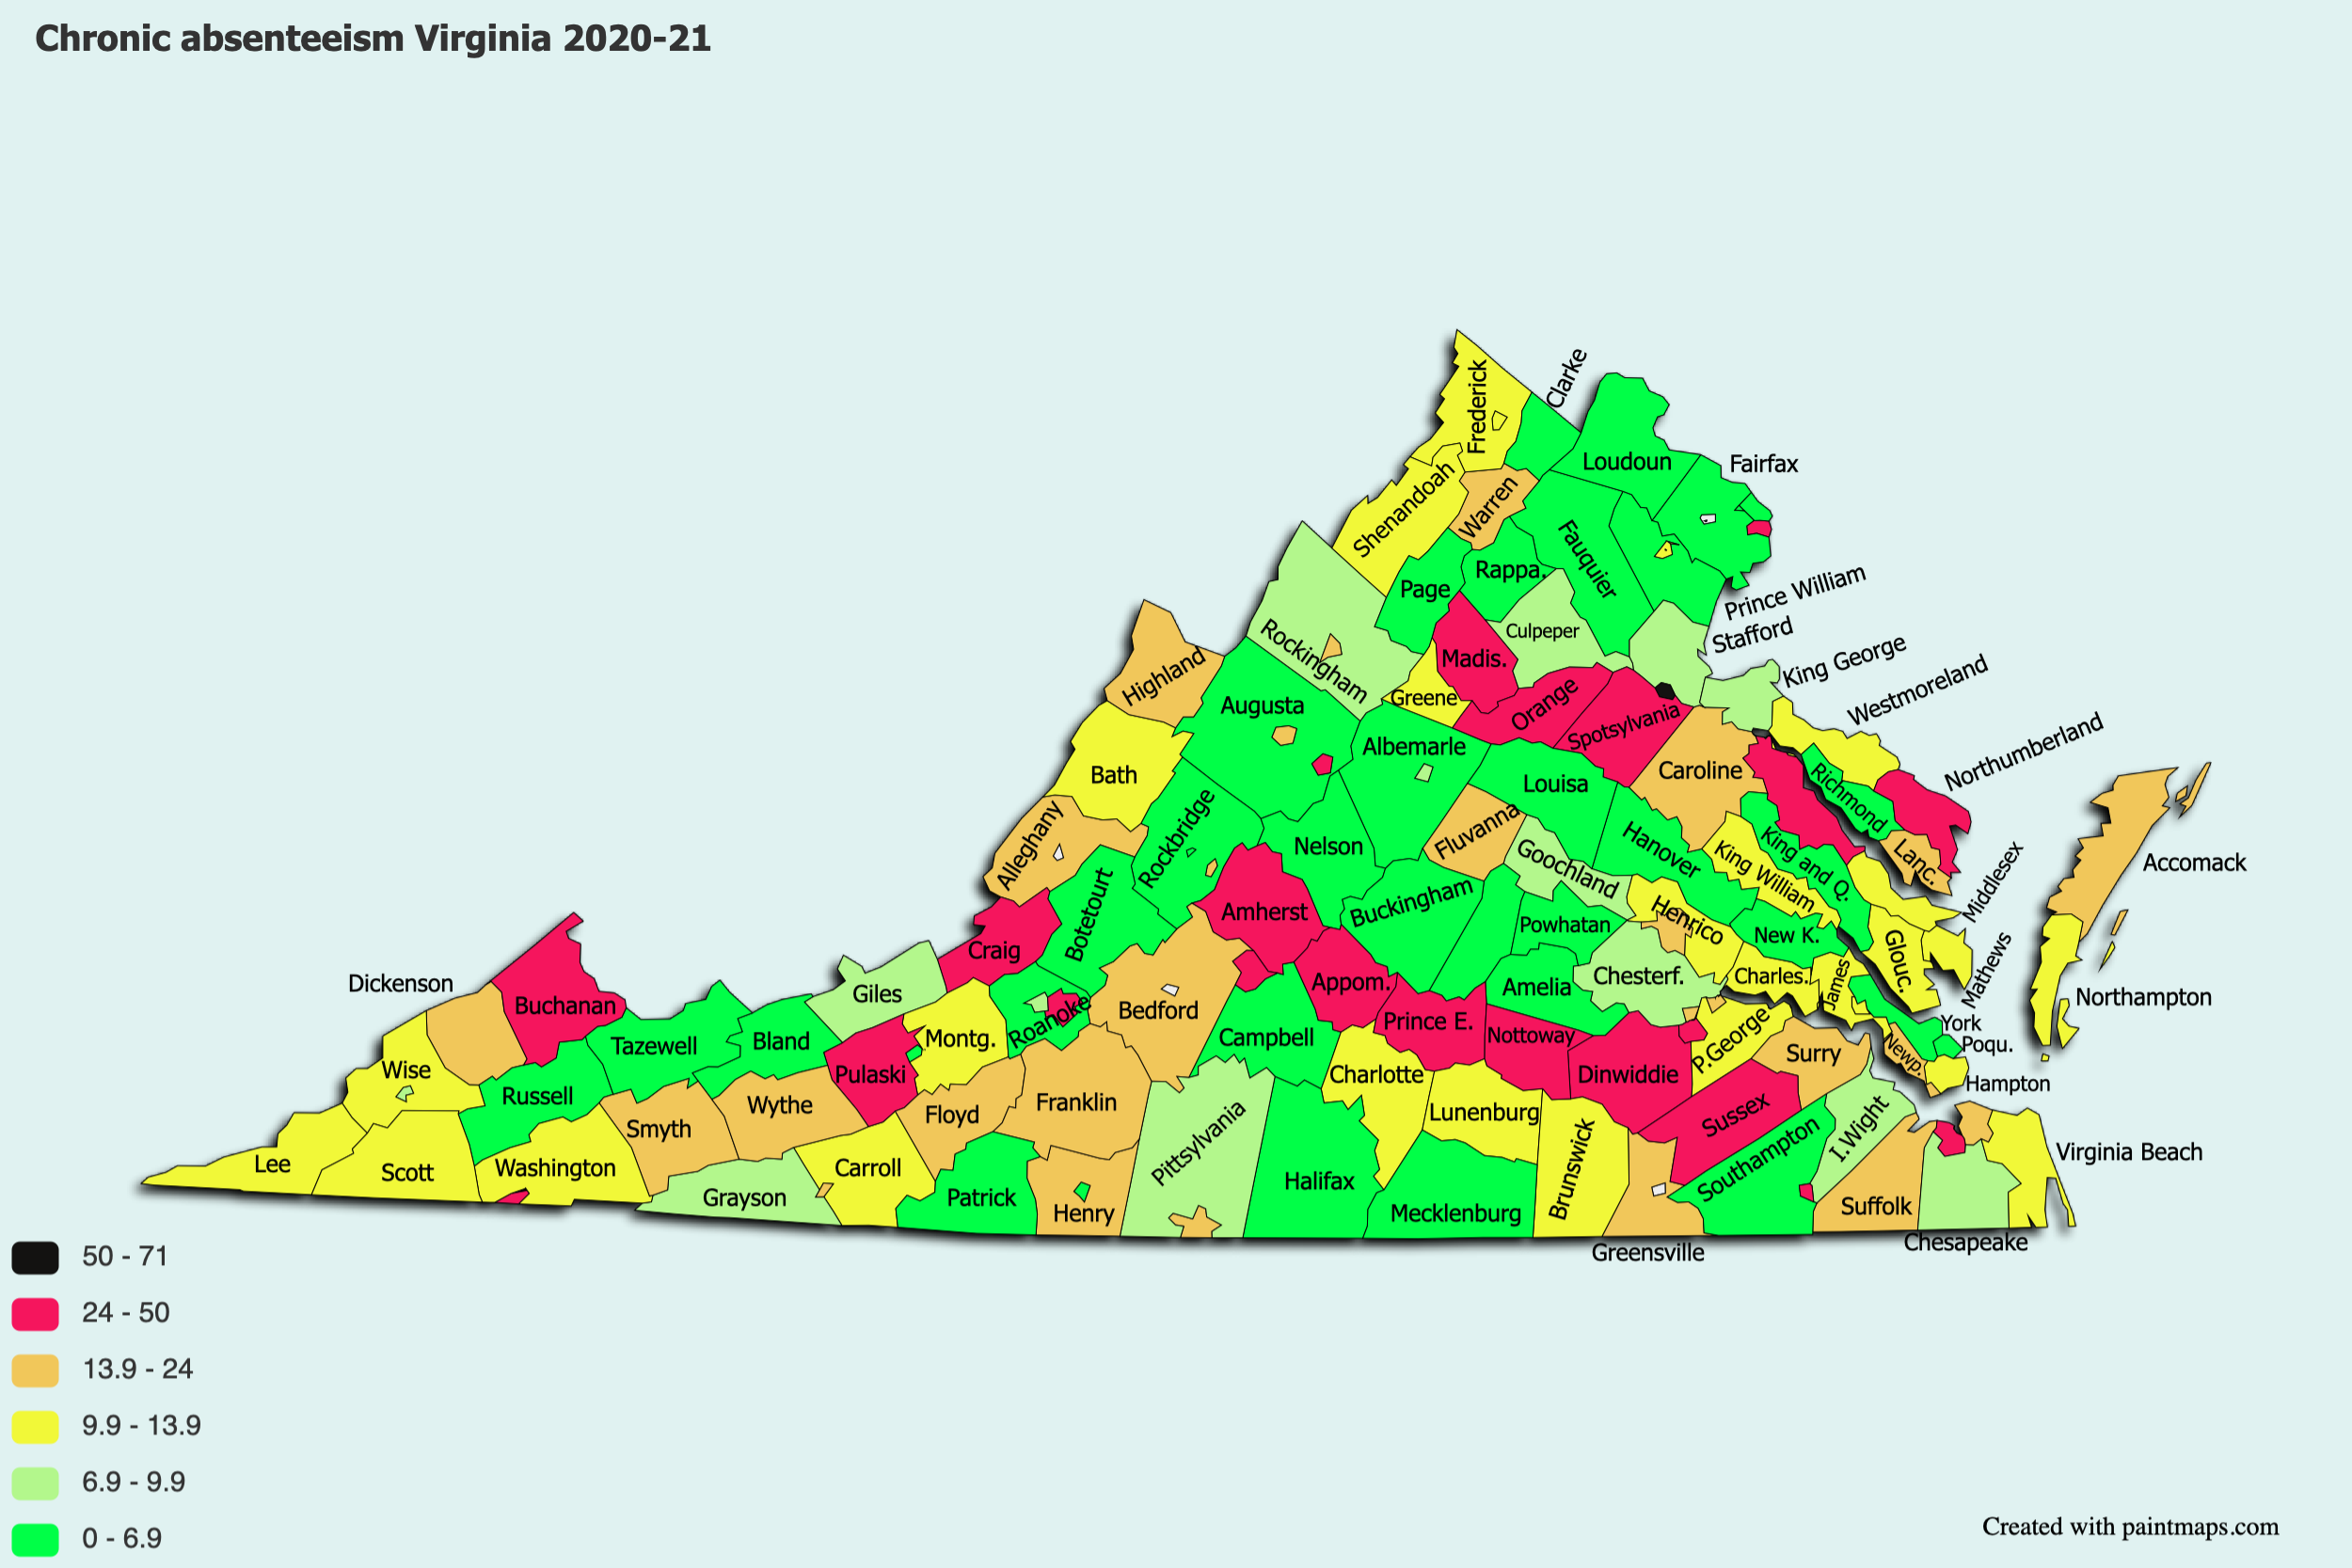
Color scale in percentage of students chronically absent 2020-21

Highest reported chronic absenteeism.

Those counties with the highest reported chronic absenteeism in 2020-21 (25% or higher) were, from the highest:

Fredericksburg (71%), Franklin City (39%), Prince Edward County, Essex County, Madison County, Lynchburg, Waynesboro, Petersburg, Craig County, Alexandria, Spotsylvania County, Buchanan County, Appomattox County, Roanoke, Portsmouth, Northumberland County, Nottoway County, Sussex County, Orange County, Dinwiddie County, Amherst County, Bristol, Pulaski County.

What else do we see?  

  1. The “tell” is the average SOL pass rates in 2021-22. The 2018-19 SOL assessments showed the students in the schools with the lowest chronic absenteeism in 2020-21 started out better  in 2018-19 than those with highest chronic absenteeism. And the SOL margins in their favor widened by the time they took the 2021-22 tests.
  2. Math learning losses are perhaps the biggest concern among the subjects shown here, because math builds on itself across the school years. The divisions with the highest chronic absenteeism in 2020-21 had both established lower math SOL baseline rates in 2018-19 and had lost more ground by 2021-22.
    1. The divisions with low chronic absenteeism did much better at minimizing math learning losses from higher SOL 2018-19 baselines
    2. Than did those with high chronic absenteeism, whose students produced higher average SOL failure rates in 2021-22 from their higher 2018-19 baseline SOL failure rates.

Which school divisions enforce truancy laws?

I ran the numbers to compute the total numbers of students in each of the divisions who were chronically absent in 2020-21 against the records of truancy referrals reported to the state.

Even in 2020-21, some divisions tried hard to get their kids to participate. The ones that tried the hardest through the courts — measured as referring 20% or more of their chronic absentees to J&D court, were, from highest percentage of referrals:

  • Martinsville
  • Wise County
  • Hopewell
  • Westmoreland County
  • Russell County
  • Hampton

Tell the truth. You did not expect that list.

The list of those who gave all their chronic absentees a pass, with none referred to court, were:

  • Alexandria
  • Amherst County
  • Appomattox County
  • Bath County
  • Bland County
  • Campbell County
  • Caroline County
  • Charles City County
  • Charlotte County
  • Chesterfield County
  • Covington
  • Craig County
  • Cumberland County
  • Dinwiddie County
  • Falls Church
  • Fluvanna County
  • Fredericksburg
  • Giles County
  • Greene County
  • Isle of Wight County
  • Lynchburg
  • Madison County
  • Manassas
  • Norton
  • Page County
  • Patrick County
  • Prince Edward County
  • Prince George County
  • Richmond County
  • Salem
  • Southampton County
  • Spotsylvania County
  • Surry County
  • West Point

Don’t feel good if your division is not on that list. Only 51 of 132 divisions sent more than 5% of their chronic absentees with their parents to truancy court in 2020-21.

I get it, lots of things were going on during that school year. The vaccinations were not available in most of the state until early 2021. But Martinsville, Wise County, Hopewell, Westmoreland County, Russell County and Hampton figured it out.

I wonder how long it took kids and parents to figure out there was going to be no truancy referral for not going to school.

I wonder if the kids who lost their futures in 2020-21 by not being in school will look back fondly at the adults who did not enforce the truancy laws.

Bottom line. OK, we get it now.

If kids show up at school, they will have a chance to learn and their teachers will have a chance to teach.

We get that kids have to go to school to learn regardless of their race, economic status, English language proficiency or anything else. Finally something the left and right can agree on?

I hope so.

But we’ll wait and see which leaders bring enforcement of truancy laws to the fore in an attempt to get kids to school.

So their teachers can teach them. And so they have a chance in life.

And we’ll see who fights it.


Share this article


ADVERTISEMENT

(comments below)


ADVERTISEMENT

(comments below)


Comments

17 responses to “Virginia Public Schools and Learning Losses – Part 2 – Chronic Absenteeism”

  1. LarrytheG Avatar

    I guess I was expecting a table with the name of the school, the absentee rate, enforcement rate and SOL scores that would be in rank order.

  2. Let us agree that there is a strong correlation between school districts with high rates of absenteeism and low SOL scores. But which way does the causality run? Does it really help to round up the truants and force them back to school? I don’t know the answer — I’m just trying to stimulate discussion.

    It is reasonable to assume that the truants who skip school are the kids who are having the hardest time learning and/or have fallen the farthest behind. They are the least likely to be engaged. If you force them back to school, clearly they will learn more than if they had continued to skip, but how much more? Enough to make a difference?

    It is also reasonable to assume that truants are more likely than other students to be disciplinary problems. If you compel them back into school, how often will they contribute to disruption and disorder? And how much will they interfere with the education of other students?

    Again, I do not know the answer. But I hesitate to simply assume that rounding up the truants and packing them into school is the optimum solution for anybody. Perhaps their time would be better spent working at an entry-level job and learning skills on the job. Just thinking out loud….

    1. James C. Sherlock Avatar
      James C. Sherlock

      Kids have to go to school. Period. Trying to sort the wheat from the chaff in life by letting kids skip school is craven disregard for their welfare by adults who ought to both know and do better.

      1. LarrytheG Avatar

        3rd and 4th graders I agree. But what about 9th and 10th graders? Still the parents and no matter if they have failed to advance in reading and writing and no longer interested in learning and more inclined to cause trouble?

    2. Stephen Haner Avatar
      Stephen Haner

      The third graders? What job do you suggest?

      I wonder how the data check goes on the report that more than 7 in 10 Fredericksburg students were chronically absent, basically double or triple the other low performers. Still doubting it. If it were 3 or 4 in 10 like the others it would still be a disaster.

      1. My comment assumed that truancy gets worse as kids get older, peaking in high school. Perhaps that assumption is wrong. I’m happy to stand corrected. Is there data that breaks down truancy by age?

        If a kid in 3rd or 4th grade is truant, then, I would agree, a strong response is called for to get them back in school.

        Until we get a breakdown of truancy by age, I think we have an imperfect understanding of what we’re dealing with.

        1. LarrytheG Avatar

          Agree.

          That’s part of the problem with the quality of the data. Making “assumptions” about it pretty much says it’s not really explicit/well characterized as a “variable”.

          This is what makes valid data analysis so tough.

          The variables have to be so well-defined that there is not a question as to what they represent.

          Isn’t there also a question about what “absentee” is or not in a virtual environment?

    3. Eric the half a troll Avatar
      Eric the half a troll

      “Let us agree that there is a strong correlation between school districts with high rates of absenteeism and low SOL scores”

      So what is the r^2…??

      1. Eric the half a troll Avatar
        Eric the half a troll

        Actually calculated the r^2 – it is 0.42. While there is a trend in the data, the correlation is actually not particularly strong suggesting that there are many other factors at play here.

        https://uploads.disquscdn.com/images/f8f71adfc238530408f130b1674ed2fc3da14101de06f414f871574813fd17ad.jpg

        1. I don’t know how to interpret this graph. Could you provide the data labels for the horizontal and vertical axes?

          1. LarrytheG Avatar

            looks like SOL scores on the Y and absentee percentage on the X ?

          2. Eric the half a troll Avatar
            Eric the half a troll

            Y is SOL Scores (latest) and X is Absentee Percentage. I realized I included ALL SOL scores and thought this may add to the lack of correlation. So I went through the spreadsheet and removed all the non – English Written scores so I only plotted the English Written SOL scores agains Absenteeism. The R^2 actually went down to 0.39 which is slightly below the 0.40 value below which it would be considered a low correlation. You can really see this in the graph. If I had the time, I would do this for each set of SOL scores and see if that added any insight to the data. Sorry, but I just don’t have the time right now.
            https://uploads.disquscdn.com/images/044017f2ab04e74ab14feb7d5f64a2af215644252bbd8009288c9080ffedeae7.jpg

          3. Eric the half a troll Avatar
            Eric the half a troll

            Y is SOL Scores (latest) and X is Absentee Percentage. I realized I included ALL SOL scores and thought this may add to the lack of correlation. So I went through the spreadsheet and removed all the non – English Written scores so I only plotted the English Written SOL scores against Absenteeism. The R^2 actually went down to 0.39 which is slightly below the 0.40 value below which it would be considered a low correlation. You can really see this in the graph. If I had the time, I would do this for each set of SOL scores and see if that added any insight to the data. Sorry, but I just don’t have the time right now.
            https://uploads.disquscdn.com/images/044017f2ab04e74ab14feb7d5f64a2af215644252bbd8009288c9080ffedeae7.jpg

  3. LarrytheG Avatar

    The data in the spreadsheet is all over the map without much rhyme or reason.

    This is pandemic data and how schools characterized and reported “absentee” is likely not consistent especially for virtual and may well differ significantly from prior years especially for lower grades.

    In other words, the quality of the data itself is suspect.

    Sherlock is good with slicing and dicing data with spreadsheets but methinks the “analysis” is speculative.

    And JABs point which has been made in more than a few prior BR articles asserting that discipline problem kids harm learning and SOL scores of other kids.

    But the data itself on absentee and referrals is just wildly different depending on the school. Are the study body’s in those different schools REALLY that different in absentee?

    I suspect the schools are not classifying the data the same way.

    Finally, to point out that many private schools also went to virtual and also had learning losses , yet we have no data for them:

    https://uploads.disquscdn.com/images/0f669e68e8ddb7e71ae531b79baa3e135aee03cced6e1ef4d8bf631faa1e37a4.jpg

    https://www.usnews.com/news/education-news/articles/2022-03-15/how-traditional-public-private-and-charter-schools-responded-to-the-pandemic#:~:text=Overall%2C%20remote%20learning%20was%20a,classes%20online%20during%20the%20pandemic.

  4. DJRippert Avatar

    What the Jim Beam is going on in Fredericksburg? Sky high absenteeism, terrible SOL pass rates …

    Have so many NoVa liberals moved to the City of Fredricksburg that it has become “Alexandria South”?

    1. LarrytheG Avatar

      Well, there is a problem. Can’t tell if it’s real , and they’re lying about it or it’s a data problem.

      I though Sherlock was going to find out.

      1. DJRippert Avatar

        But Fredricksburg also was near the bottom of the list in the article titled, “Another way to crunch the SOL numbers.” In fact, it was 6th from the bottom. There’s no doubt about that data as far as I know.

        https://www.baconsrebellion.com/another-way-to-crunch-the-sol-numbers/

Leave a Reply