Virginia is for Bigots?

Map Source: The Atlantic magazine. Click here to view Atlantic’s interactive map.

Virginians are among the more politically intolerant people in the United States, judging by a map published by The Atlantic magazine. If you accept the validity of The Atlantic’s methodology, such a finding says a lot about contemporary Virginia politics in the era of Ralph Northam, blackface, and the social justice wars.

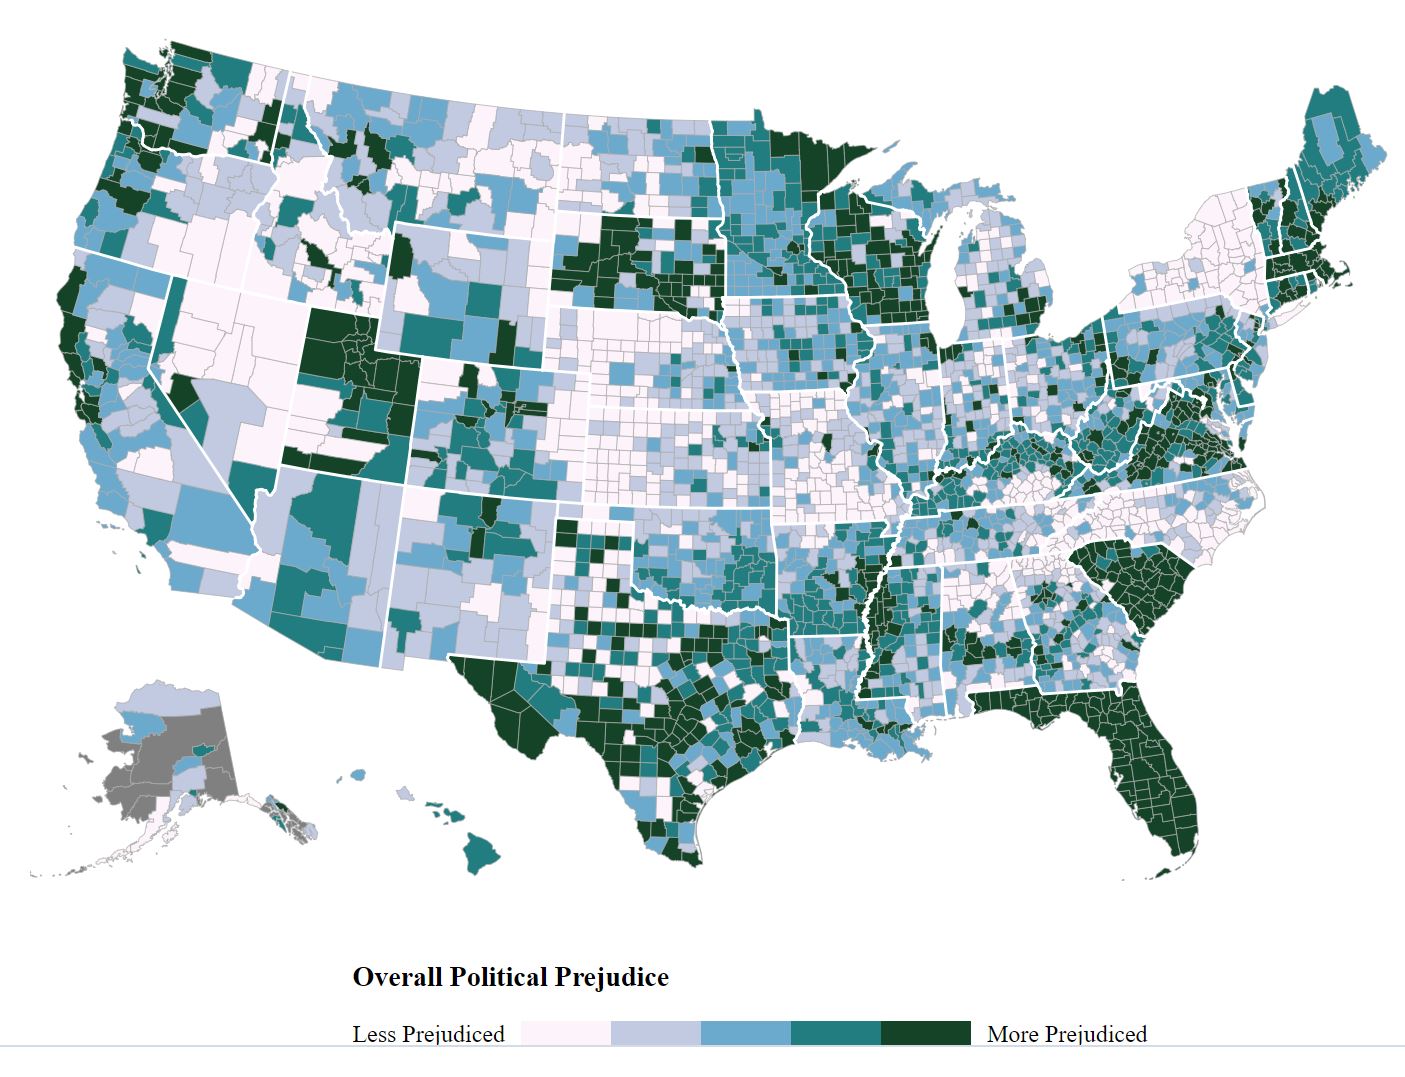
The Atlantic hired PredictWise, a polling and analytics firm, to create a ranking of counties in the U.S. based on partisan prejudice, or “affective polarization.”  The results showed significant variation geographically. The Northeast, parts of the Midwest, and the coastal enclaves of the West Coast are bastions of liberal/leftist intolerance to those with opposing views. South Carolina, Utah, and swaths of Texas, predominantly conservative, stood out for their narrow-mindedness. Florida and Virginia, classic “purple” states, also show strong strains of prejudice, as can be seen in the map above.

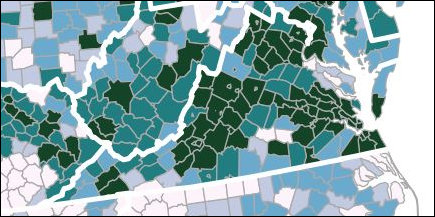
Within Virginia, intolerance was pervasive across most the state. The only pockets of relative forebearance were located in non-metropolitan counties in Southside, Southwest, and along the Chesapeake Bay.

The study does not paint a positive picture of Virginia (unless you really, really hate the other guys and believe that intolerance in the pursuit of virtue is no vice). But the methodology is open to question. It is not based on direct polling data of Americans on a county-by-county level. PredictWise polled 2,000 Americans nationally to capture peoples’ feelings about the other people. How would they feel if a close family member married a Republican or Democrat. How well did they think the terms selfish, compassionate, or patriotic describe the other guys? Then the firm extrapolated findings with age, race, urbanicity and partisan loyalty to each county based on its demographic characteristics. (Gender was the main demographic factor that did not correlate with intolerance.)

I don’t know much about statistics, but I believe it should be possible for PredictWise to calculate (within a margin of error) how much each of its demographic variables account for the variation in political intolerance. Do they explain 50% of the variability? 90%? If they explain only half, could geographic-specific factors account for the difference?

The methodology makes no effort try to determine if tolerance might vary with the peculiarities of regional culture, history, media influence, or other localized factors. It assumes that the demographic patterns (age, education, etc.) apply uniformly across the board. And the results are bit strange — high degrees of intolerance coinciding strongly with state borders. Thus Virginia, South Carolina, and Florida are intolerant, while North Carolina, Georgia and Alabama are tolerant. Does that pattern accurately reflect reality?

Despite those caveats, The Atlantic findings do ring true, at least in part:

In general, the most politically intolerant Americans, according to the analysis, tend to be whiter, more highly educated, older, more urban, and more partisan themselves. This finding aligns in some ways with previous research by the University of Pennsylvania professor Diana Mutz, who has found that white, highly educated people are relatively isolated from political diversity. They don’t routinely talk with people who disagree with them; this isolation makes it easier for them to caricature their ideological opponents.

The phenomenon certainly describes the myopia of media elites in New York and Washington. They live in liberal/leftist monocultures epitomized by the famous (but apocryphal) Pauline Kael quote, “I can’t believe Nixon won. I don’t know anyone who voted for him.” There is no one more smugly arrogant than a highly educated white person — Bacon’s Rebellion readers excepted — who considers himself very informed and well read and views with the contempt the ignorant views of the great unwashed in the other political party.

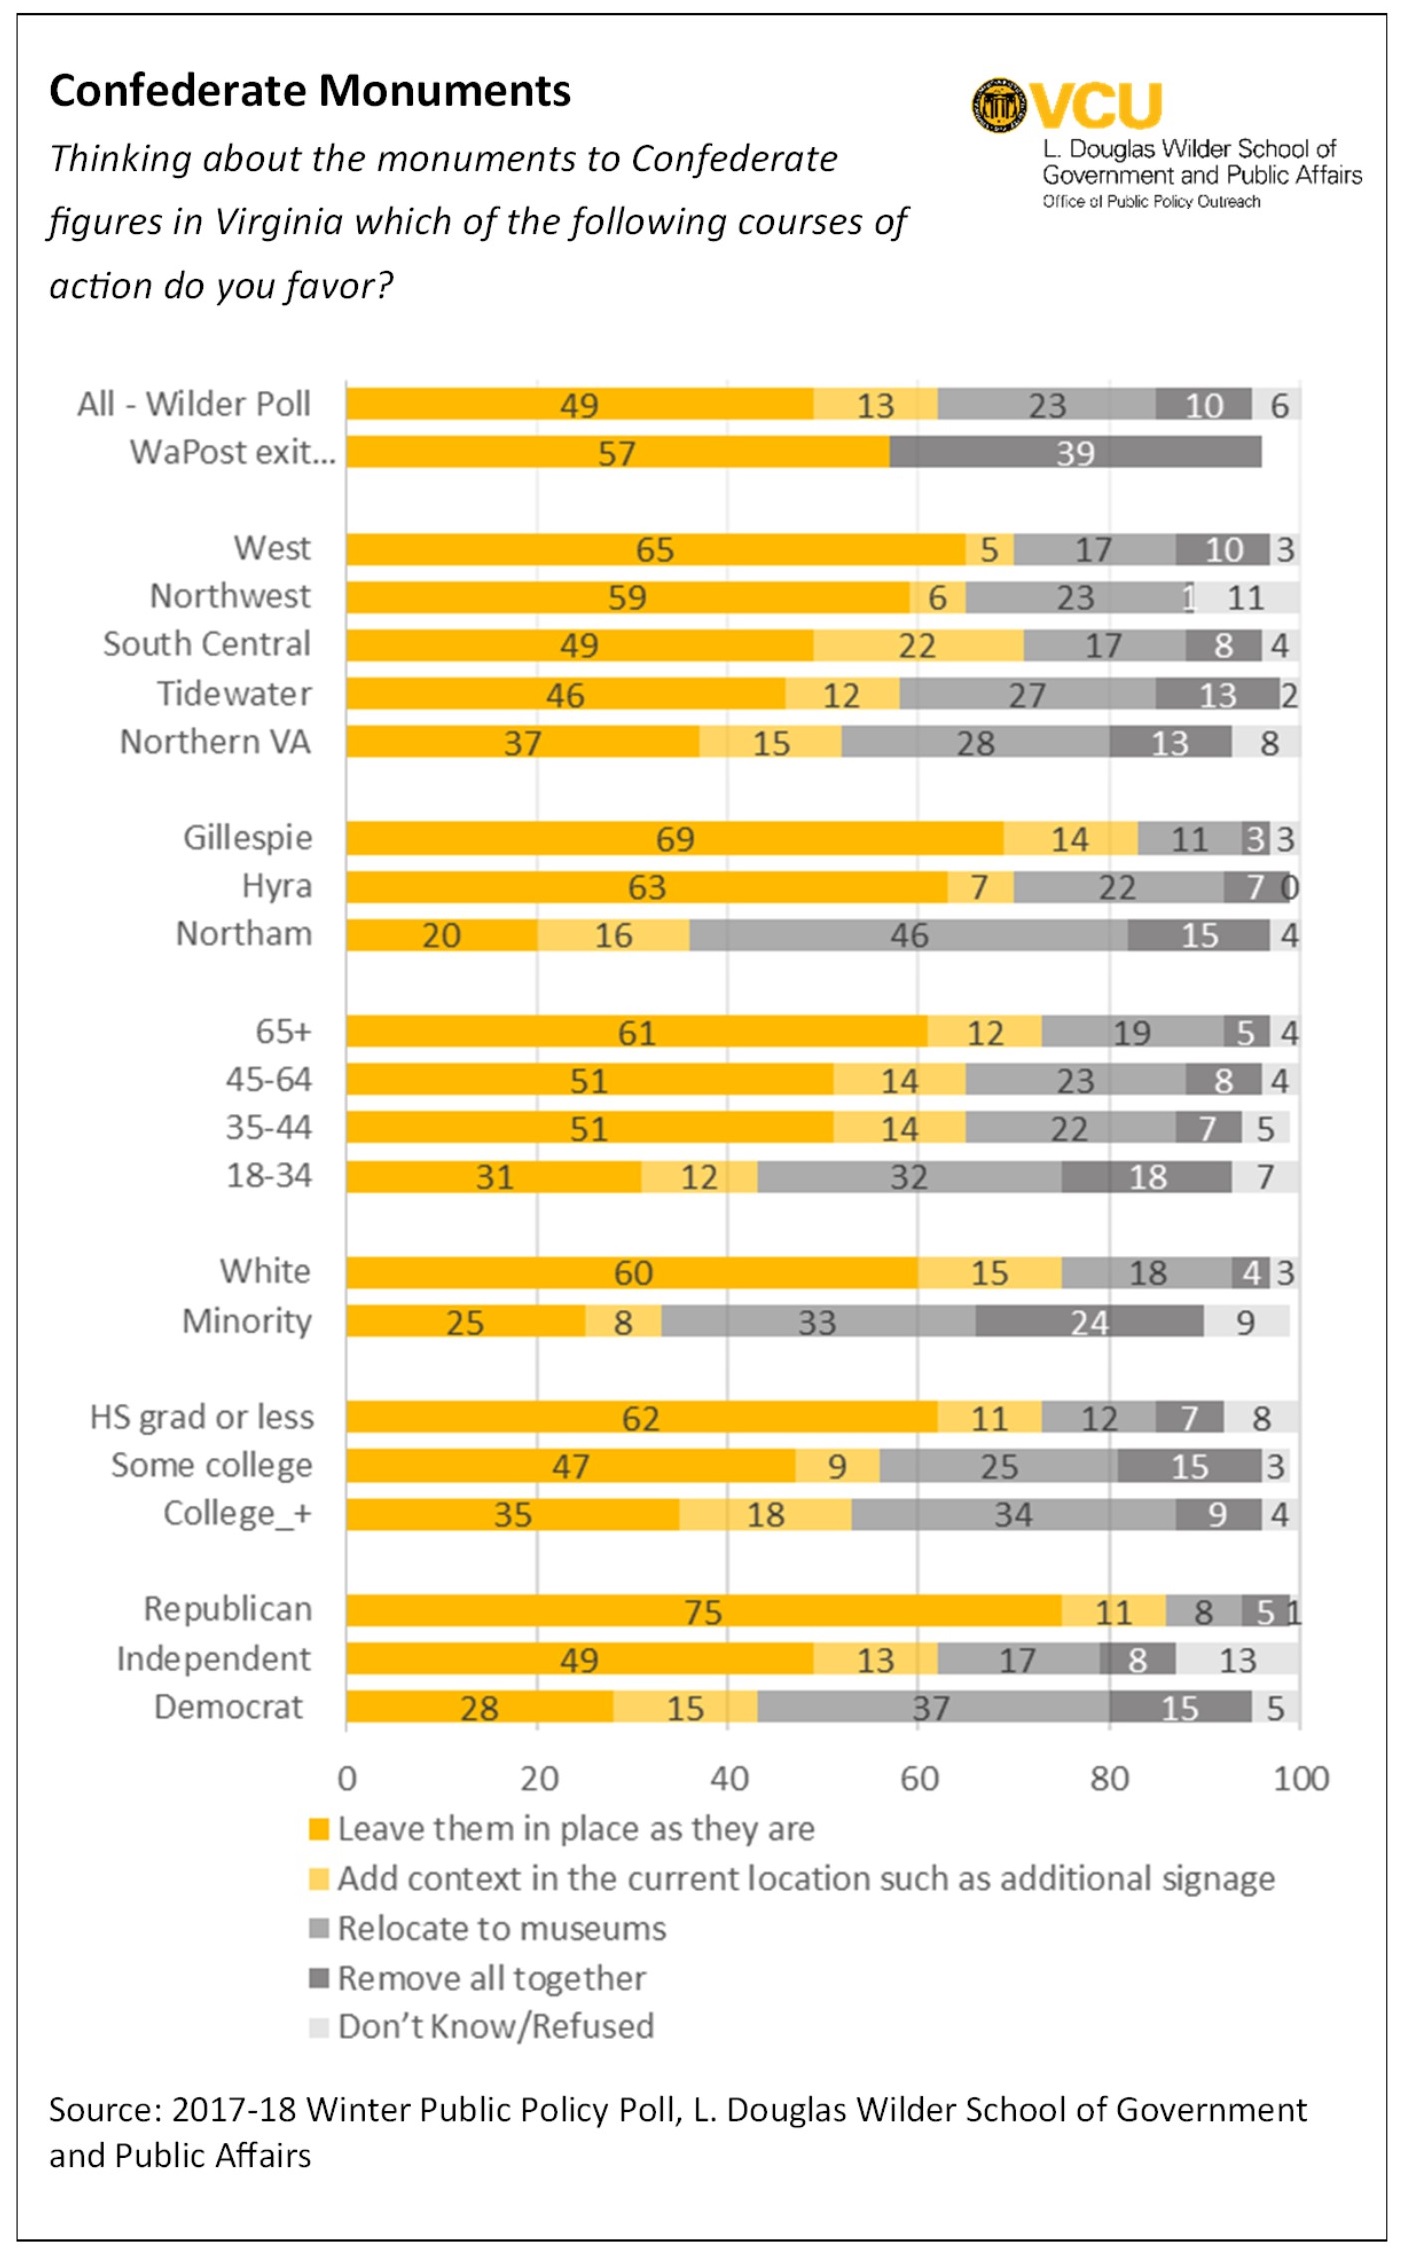
The Atlantic’s findings provide interesting context to poll results in which Virginia blacks appear to be more forgiving of Governor Ralph Northam’s 35-year-old blackface transgression than whites, as measured by their belief that he should step down from office. One would think that blacks, who are said to find blackface highly offensive, would be more likely than whites to demand his resignation. To the contrary, Virginia whites are more likely to wax indignant and say the governor should go.

This particular instance may be anecdotal, but it’s a vivid anecdote. I think the Atlantic’s intolerance map may reflect reality in Virginia. In my experience, the intensity of intolerance and self-righteousness has ratcheted up tremendously in the past few years. People get angrier at people on the other side of the ideological fence than they used to. I have seen old friendships break up over politics. And the situation is getting worse: The more polarized people get, and the more they seek confirmation of their biases from those around them, and the more they shun those with views they find offensive, the more  blinkered they get in their thinking and the more intolerant they become.

This is an ugly dynamic. Where it stops, nobody knows.


Share this article


ADVERTISEMENT

(comments below)


ADVERTISEMENT

(comments below)


Comments

12 responses to “Virginia is for Bigots?”

  1. djrippert Avatar
    djrippert

    I read the article a few days ago. I don’t think Virginians were necessarily polled. My understanding is that the demographic results of a relatively small poll were applied across the country based on demographics. If I understood the process properly I have some doubts about the results.

  2. Reed Fawell 3rd Avatar
    Reed Fawell 3rd

    Chevy Chase Md. thumbnail profile in 2016:

    Median family yearly income: $420,000
    Median home costs: $1.52 million
    95% are married, with both parents or adults living at home
    13 residents raised over $100,000 for Hilary for President
    Hilary beat Trump at polls by 56 points.

    Likely Potomac Md, and parts of Alexandria, Arlington, and Fairfax, Virginia, and NW Washington fit a roughly similar profile. All rank very high in political prejudice per above map. Chevy Chase’s numbers come from Alienated America by Timothy Carney.

    Are these the kinds of places where the bigots live?

  3. djrippert Avatar
    djrippert

    The poll was of 2,000 adults. There are 3,142 counties and county-equivalents in the US. This “survey” is extremely misleading in my opinion. It really doesn’t assess differences by geography. It extrapolates a relatively small poll to everywhere in the United States by using demographic data from those who were polled. I don’t buy the results …

    To do this assessment, PredictWise first partnered with Pollfish to run a nationwide poll of 2,000 adults to capture people’s feelings about the other party. The survey asked how people would feel if a close family member married a Republican or a Democrat; how well they think the terms selfish, compassionate, or patriotic describe Democrats versus Republicans; and other questions designed to capture sentiments about political differences.

    Based on the survey results, Tobias Konitzer, the co-founder of PredictWise, investigated which demographic characteristics seemed to correlate with partisan prejudice. He found, for example, that age, race, urbanicity, partisan loyalty, and education did coincide with more prejudice (but gender did not). In this way, he created a kind of profile of contemporary partisan prejudice.

    Next, Konitzer projected this profile onto the broader American population, under the assumption that people with similar demographics and levels of partisan loyalty, living in neighborhoods with comparable amounts of political diversity, tend to hold similar attitudes about political difference. He did this using voter files acquired by PredictWise from TargetSmart, a commercial vendor. Voter files are essentially data snapshots about all American adults, based on publicly available records of voter registration and turnout from past elections, along with data about neighborhood variables and demographic traits. In this way, PredictWise was able to rank all 3,000 counties in the country based on the estimated level of partisan prejudice in each place. (For more technical detail about the methodology, click here.) “What I find most striking is that we find a good degree of variation,” Konitzer says. Some states, like Texas, show a real mix of prejudiced and nonprejudiced counties; whereas Florida is very consistent—and fairly prejudiced—from place to place.”

    1. Reed Fawell 3rd Avatar
      Reed Fawell 3rd

      That is a very interesting comment. And doubly so, because at first glance it seems to tally closely with the central message of the Alienated America book by Timothy Carney, his point being that such demographic studies by their nature should be be made to pick up on, and expose, and differentiate, the great complexities within each PLACE, and thus should search out and find the various impacts they have based on profiles of different individual groups within that place. Thus one finds places full of surprises that otherwise might be missed. Hence DC region’s proximity to Federal Government gives it a unique spin on individual groups of voters. Book does same with wildly different places to make same point in different ways. Its a book worth reading to better understand what is going on in America. And seems to my untutored eye to tie in with this map methodology.

  4. Seeing such a sharp difference between adjacent counties in different states (e.g. Virginia and North Carolina or Florida and Georgia) suggests there may be issues with methodology that need to be examined. The demographics in those more rural counties is probably pretty similar. Or perhaps the saying about Virginia, North Carolina, and South Carolina needs to be updated to something like “North Carolina, a valley of tolerance between two mountains of prejudice.”

  5. LarrytheG Avatar
    LarrytheG

    If they used Demographics to then project on counties not actually surveyed – then as Izzo points out the map IS showing differences so something is amiss.

    this one looks legit though:

    https://wilder.vcu.edu/media/wilder/images/R2Monuments.jpg

  6. Posted on behalf of Les Schreiber:

    I grew up in a Virginia when it was controlled by the Byrd machine. As a member of the Jewish, faith I was subject to various forms of social discrimination. When Linwood Holton was elected, he was viewed as a Republican that would bring Virginia more in line with the necessary social changes that were taking place then. Over time, in many areas of the South, the Republicans began to adopt the policies of George Wallace, leaving. only the Democratic party for the socially tolerant voter.

    When I moved to New York, I often voted for Republicans such as Jake Javits and Nelson Rockefeller. Unfortunately, this type of Republican has been purged out of the party. I think, in its current form, the Republicans really don’t offer much to a these educated, upper middle class voter. The current resident of 1600 Pennsylvania Ave. has worsened the future for the party. I hope that Cory Booker and Bill Weld come forth a challenge

  7. J. Abbate Avatar
    J. Abbate

    While I believe that any poll’s methodology could be skewed to lead to inaccurate conclusions, I tend to agree with James that this poll may highlight some of the issues pertaining in the current VA political climate. The statement…”There is no one more smugly arrogant than a highly educated white person — Bacon’s Rebellion readers excepted — who considers himself very informed and well read and views with the contempt the ignorant views of the great unwashed in the other political party” resonates with me. For the past 4 years, I have been in close discussion with African American community members of Union Hill in Buckingham County, near where I reside and work.I believe that the gulf between Gov. Northam and the communities like Union Hill that still struggle economically are more cultural and economic, rather than specifically racist. In one discussion with a local county supervisor, I noted that I had not seen any specific evidence of actual racist attitudes in the local government. The supervisor responded, explaining to me that racism still exists in the region, but that the local governments work hard to ensure that citizens have at least equal access to their rights and services. It may be that racism is not an explicit bias present in government policy and decisions, but that there remains the fact that the monied and educated class have somewhat more capacity to take advantage of the rights offered in our state vs. those less educated and with less financial capacity. I find these discussions of racism and prejudice in Virginia here in Bacon’s Rebellion to be interesting and revealing, and I thank you for the opportunity to examine the topic.

    1. Reed Fawell 3rd Avatar
      Reed Fawell 3rd

      Welcome aboard, J. Abbate.

  8. IMO Izzo strikes the right note, here. There is no logical reason, other than flawed extrapolation, why Prince Edward, Nottoway, King George, Richmond, Middlesex and Grayson Counties should be identified as particularly tolerant outliers in sharp contrast to their immediate neighboring counties. As for NC being an overall “valley of tolerance,” someone needs to inform the Republican majority in the NC GA of that.

    1. Reed Fawell 3rd Avatar
      Reed Fawell 3rd

      Explanation for that mystery is likely found in book Alienated America. The message there is that you cannot reach fully sound explanations from 10,000 feet using statistics alone. You must get you feet on the ground talking to people. Hence, for example, Trump supporters in poorer communities were found primarily within the wealthier segments of those poorer communities.

  9. LarrytheG Avatar
    LarrytheG

    re: ” There is no logical reason, other than flawed extrapolation, why Prince Edward, Nottoway, King George, Richmond, Middlesex and Grayson Counties should be identified as particularly tolerant outliers ….”

    DOES make one wonder just what demographic data or analysis techniques they were actually using though that would lead them to that conclusion!!!

    So this is getting to be par for the course these days on polls – AND so-called “studies” where any fool with any credentials can play.

    the rule today on these things is to not take it on face value – dig down a little and see if it passes the smell test… many do not…

Leave a Reply