Virginia Energy Bills Slightly Below National Average

energy_bills

The average monthly energy bill per household runs about $284 in Virginia, lower than the national average, according to our list-compiling friends at WalletHub. The Old Dominion ranks 20th lowest of the 50 states and Washington, D.C.. Connecticut households pay the most per month, $404, while residents of the state of Washington pay the least, $218 per month.

WalletHub ranked the states in each of four categories — electricity, natural gas, motor fuel and home heating oil — by multiplying the average monthly consumption times the average monthly price.

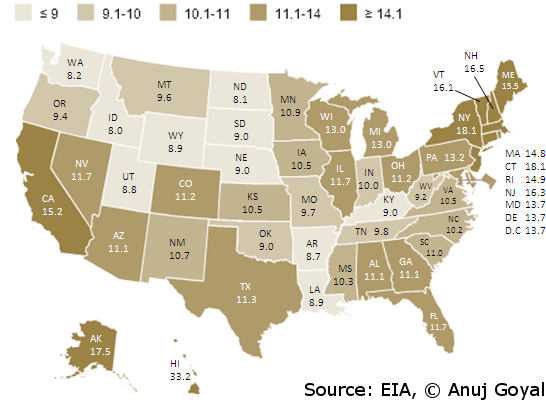
Virginia performed best in the areas of home heating oil (13th lowest) and electricity (14th lowest) and the worst in the areas of natural gas (32nd lowest) and motor fuel (35th).

Bacon’s bottom line: The WalletHub ranking provides fuel for thought: How could public policy in Virginia do a better job of reducing energy costs for its citizens? Are we doing something right when it comes to electricity regulation, where we score well, or are we just lucky to live in a moderate climate? Does restricted pipeline capacity push up natural gas prices? And why would our gasoline prices be higher than elsewhere?

One needs to be especially careful comparing electricity and heating oil rates, which vary widely by climate. Massachusetts households, for example, have lower average electric bills than Virginia. Does that mean Massachusetts residents enjoy lower rates or pursue energy efficiency more aggressively? Not necessarily. Massachusetts households are far more likely to heat their homes with heating oil (spending an average of $78 a month) than Virginians ($10 a month), substituting heating oil for heat pumps and electricity. Conversely, because Massachusetts is cooler in the summer, residents need less air conditioning than Virginians, and they use less electricity in summer as a result. But Bay Staters spend more on electricity and heating oil combined ($193 per month) than Virginians ($151 per month).

Another factor not considered here: energy efficiency. Some states have invested heavily in energy efficiency, while others have not — Virginia is frequently criticized on that score. Thus, despite higher electric rates, New Jersey households spend only pennies more on average for their electric bills than Virginians. On the other hand, money spent on energy efficiency is also a capital expense, even if it doesn’t show up in the WalletHub scoring.

The picture gets complicated quickly, so the numbers presented here represent no more than a starting point to think about energy bills.

— JAB


Share this article


ADVERTISEMENT

(comments below)


ADVERTISEMENT

(comments below)


Comments

18 responses to “Virginia Energy Bills Slightly Below National Average”

  1. The relatively poor showing in natural gas for home heat makes sense as it seems like we pay too much there, considering the tremendous fall in natural gas prices. Residential users don’t tend to see the reduction in natural gas prices reflected in their bills, as utilities historically charge a lot for their overhead and services.

    Massachusetts has very high electricity rates, double ours I believe, so I don’t immediately understand how they could pay less. I know it has been said Virginia electric bills are high – we have cheap elec rates but we apparently use lots more electricity – but I am not clear on what accounts for that. Is the VA internet data center electric use getting averaged in?

  2. LarrytheG Avatar
    LarrytheG

    interesting map:

    https://morgansolar.files.wordpress.com/2009/05/us-map.gif?w=592

    still looking for one that shows per capita consumption but would not be surprised at all to see a correlation between per capita use and costs.

    That’s where the critics of the CPP go wrong in claiming increased costs – when prices go up – people conserve by becoming more efficient – and in turn also reduce pollution.

    1. Something not quite right with the elec rate map. We pay closer to 12 cents and at least in Boston, MA closer to 25 cents according to my sources. Interesting about the consumption map. I wonder why VA is higher consumption than say NJ about the same climate. Maybe we have more heat pumps instead of oil and gas?

  3. 🙁 My electric bill the last 2 months was $60 something and $77.

    1. Wow, do you live in a Tiny House?

  4. TooManyTaxes Avatar
    TooManyTaxes

    Point of reference. All electric utilities in Nebraska are publicly owned and have been since the 1940s. Shades of William Jennings Bryan.

  5. I have heard about Virginia’s low electric rates since I moved here a number of years ago. They are OK, certainly better than the $0.22 /kWh I was paying in Hawaii 10 years ago. But given the moderate climate, they could be better. All the states surrounding us with similar climates have lower rates as shown below: (prices are all in cents/kWh)

    TN 10.22
    KY 10.36
    WV 11.29
    NC 11.72
    VA 12.00

    All of these rates are based on the U.S. Energy Information Administration Electric Power Monthly Report for April 2016. These are residential rates because commercial and industrial rates vary much more widely by state for a variety of reasons. Virginia’s rate seems accurate to me because my last Dominion bill calculated out as 11.98 cents/kWh including distribution, transmission, generation and fuel charges but excluding all of of the various taxes and fees.

    Of this list of 51 (DC is included) Virginia ranked 27th. The average rate was 13.21, so we are a bit below average. But four of the states had rates above 20.00 and eight were above 17.00 /kWh. So the average is pushed much higher because of these outliers, including Hawaii at 26.93.

    NY 17.39
    VT 17.52
    NH 18.67
    RI 19.43
    MA 20.64
    AK 20.72
    CT 21.15
    HI 26.93

    Nearly all of the states that were more expensive than Virginia had much more extreme weather, either hotter or colder. The only exception was:
    DC 13.48
    MD 14.37

    I wrote this off as some sort of beltway effect. Others might have a better explanation.

    I am not criticizing Dominion or other Virginia utilities. I believe they are reasonably well managed. But we crow about our lower than average rates when those states around us with a similar climate all have lower rates. The states that are higher have to deal with more more extreme conditions. Even California with its far higher cost of living has a rate of just 12.40, not much different than ours.

    I guess my point is that unless you do something exceptional, don’t crow about it. Even if you do – keep quiet and let the results speak for themselves. Virginia’s rates are an unexceptional achievement.

    The current rates as of April 2016 for all 50 states plus DC are shown below from lowest to highest:

    LA 9.17 1
    WA 9.33 2
    ID 9.87 3
    AR 10.04 4
    TN 10.22 5
    MO 10.36 6
    KY 10.36 7
    OR 10.50 8
    ND 10.52 9
    NE 10.65 10
    UT 10.71 11
    OK 10.93 12
    WY 10.99 13
    MS 11.01 14
    MT 11.03 15
    FL 11.07 16
    GA 11.16 17
    TX 11.28 18
    WV 11.29 19
    NM 11.34 20
    SD 11.39 21
    IA 11.71 22
    NC 11.72 23
    CO 11.78 24
    IN 11.84 25
    NV 11.89 26
    VA 12.00 27
    AZ 12.36 28
    CA 12.40 29
    AL 12.42 30
    MN 12.62 31
    OH 12.76 32
    SC 12.77 33
    IL 12.79 34
    KS 13.45 35
    DC 13.48 36
    DE 13.90 37
    PA 14.27 38
    ME 14.34 39
    MD 14.37 40
    WI 14.45 41
    MI 14.95 42
    NJ 15.52 43
    NY 17.39 44
    VT 17.52 45
    NH 18.67 46
    RI 19.43 47
    MA 20.64 48
    AK 20.72 49
    CT 21.15 50
    HI 26.93 51

  6. LarrytheG Avatar
    LarrytheG

    why would the RATE have anything to do with the weather?

    isn’t the rate due to the cost of generation and other factors like taxes and regulations?

    what I notice is a correlation between the RATE and the CONSUMPTION.

    the HIGHER the RATE the LOWER the consumption.

    no? notice the consumption of the states within southern or northern regions.

    where electricity IS cheaper – the consumption looks to be higher.

    are there any states that contradict that premise?

    1. For those states that have a moderate climate, such as Virginia, the summer and winter peaks are not too different. Therefore, you can have fewer generating units with higher capacity factors, including peakers.

      Peakers are expensive partly because they are not very efficient (about 35%). But most combustion generating plants (coal, natural gas, cars, etc.) are about this efficient – until the heat recovery in combined cycle plants came along.

      The main contributor to their high price is the fact that you pay the full capital cost, but use it just 3-10% of the year, which is the typical capacity factor for a peaker. Or 20-40% for an older intermediate load unit.

      If you are in a location with two roughly similar seasonal peaks you can get greater cost recovery for your investment for a peaker running 10% of the year or an intermediate unit running 40% of the year compared to a utility that has one primary peak season where these units might run 5% and 20% respectively. Since our current rate design is based on cost of service plus a rate of return, utilities in moderate climates should have somewhat lower rates.

      The electricity price does not directly correlate with your energy usage map because winter heating is often provided by other means. In NY for example, heating is usually done with natural gas or heating oil. Only rental units where the landlord would install the cheapest unit and stick the tenant with a high utility bill would electricity be used for heating. So the expensive states in the north don’t use less electricity because it is expensive – they use another source of fuel for heating because electricity is expensive. Air conditioning needs electricity, so the Southern states use more electricity.

      States with moderate climates can use heat pumps for heating and cooling and get a reasonably good result. But these units do not work well when the temperature gets too hot or too cold. This is probably one of the reasons Virginia has a higher electricity consumption compared to others. We also have a near total avoidance of using energy efficiency here – Dominion was rated last in the two categories relating to energy efficiency compared to the other 30 largest utilities in the U.S.

      There are also other factors. Hawaii probably has one of the lowest per capita energy consumption levels – but by far the highest rates. They have no native fuel sources (except sunshine) and except for Oahu the population centers are small and widely dispersed over mountainous terrain so their cost of service is very high.

      Other states might have a special advantage such as cheap hydro power. The northwest (Washington, Oregon and Idaho) has access to the Bonneville Power network which lowers their rates compared to others. And of course the TVA states in our region get a helping hand from those government projects.

  7. LarrytheG Avatar
    LarrytheG

    Thanks TomH … do you consider New Mexico and California and Florida to be anomalies in terms of electricity for cooling?

    note- there are “lots” of “maps” out there… I just grabbed a few… and not all of them totally match each others although I tend to think the EIA data is valid.

  8. I know that California has energy efficiency embedded in its building codes. They also have a high-penetration of residential solar. If the data used for the electricity usage graph is taken from utility bills, then net metering would result in a much lower energy use being reported than was actually the case. I don’t know much about New Mexico. I suspect it might be similar to California. Arizona is different because they have discouraged residential solar.

    Even though Florida has plenty of sunshine, the dominant utilities there have greatly resisted residential solar in order to protect their large fleet of nuclear plants. Those old nukes have also kept the rates fairly low. The day of reckoning will come when the nuclear plants will have to be closed down or retrofitted at a substantial cost. California is not putting up artificial barriers to protect their nukes and they are being retired as their licenses expire because renewables are cheaper.

    In forward looking states such as New York and California the utilities are beginning to depart from the old baseload concept. In adapting to a higher percentage of renewables they are using energy efficiency and demand response tools, plus some storage rather than depending only on baseload generation. The shifting of load to meet available generation will become more commonplace and fewer utilities will solely rely on the old technique of adding generation to meet changes in load.

    My concern with the EIA map is that it is probably a combined rate of residential, commercial and industrial rates, because the numbers are too low for just residential. The difficulty with using a combined rate is that “rates” per kWh for commercial and industrial users are less than residential which lowers the average number. But the bills for commercial and industrial users are about 50% “rates” and 50% demand charges so the rates for these users don’t accurately reflect their true cost of energy. The EIA residential rates for April 2016 that I included are the most accurate that I have seen that represent differences in energy costs between the states.

  9. LarrytheG Avatar
    LarrytheG

    agree with last comment. data – including visualizations like maps can be virtual hash… have to be careful knowing what the data is and is not and be even more suspect when positing cause and effect.

    But you said: ” In forward looking states such as New York and California the utilities are beginning to depart from the old baseload concept. In adapting to a higher percentage of renewables they are using energy efficiency and demand response tools, plus some storage rather than depending only on baseload generation.”

    How do you deal with the variability of renewables if you do not use peaker-type plants to step in and pick up the slack when renewables sag in output?

    question 2 – what do you use at night ? Do you just run baseload 24/7 so it can take over at night if baseload cannot be brought online at dusk – fast enough to take over from solar?

    1. This is an excellent question and one that many utilities and third-party suppliers are wrestling with. We are still in the early stages of innovation and implementation. But I can give you a few examples.

      For rapid load variations, consider if electric water heaters and electric based central heating and cooling units could be turned off for 15-minute intervals by a remote signal (from the utility or energy service company aggregator). You would still have the hot water and air temperature that you desire, but having a large block of customers like this would provide a significant load following resource that can be bid into PJM just as a peaker is.

      This is what I was describing as making the load follow the available generation instead of adding more generation to follow the load.

      Participation would be voluntary, so nobody would be coerced. Residents would receive a payment or a lower rate for their participation. The grid would have a rapid response mechanism to follow load variations.

      To replace some baseload capacity, buildings could have thermal storage, hot or cold, that is much cheaper than electrical storage is currently, that could take energy from solar output when it is plentiful (the “duck curve”) and use it later in the day when solar is not available at a far lower cost than new baseload generation. This could be ice storage, phase change materials or other methods depending on which one best suits the application.

      These are simple examples, but ones that are cost-effective and available today. Many more are on the way.

  10. LarrytheG Avatar
    LarrytheG

    okay – so you do not subscribe to the idea that peaker plants would be how to respond to the variability in solar and wind?

    so you’re okay with gas being used for baseload plants instead of peakers?

    based on your response – as to how to deal with variations – on the demand side ….

    how is DVP current stance not right – for them ?

    They can’t change the demand side… so for them the reality is to continue the status quo and not adopt renewables unless and until those renewables are being also matched by demand-side changes by ratepayers?

    I suspect I’m not going to like the answer…

    1. I did not say I did not support the use of peakers to meet the variability in solar. I was responding to your question:

      “How do you deal with the variability of renewables if you do not use peaker-type plants to step in and pick up the slack when renewables sag in output?”

      The example I used showed one way to meet the variations in output in solar without using peaking units as much. These load reduction responses could turn out to be less expensive because they would require less capital and would not be vulnerable to rising natural gas prices. And would not have the CO2 and other environmental impacts involved with natural gas use.

      The other example I gave was a load displacement alternative to avoid building more natural gas-fired baseload plants. I am concerned that Virginia’s headlong rush to build more natural gas infrastructure (power plants and pipelines) will greatly increase customers’ utility bills. And will not deal with climate change issues as advertised by the energy industry.

      Dominion can change the demand side. Their Demand Side Management (DSM) programs have had only minimal effect because they are not trying very hard. Most of what they are doing is peak shifting rather than overall load reduction, because peak shifting saves them money, while load reduction costs them money.

      They will adopt renewables because solar is less expensive than their other choices. But they only want to allow solar (utility scale plants owned by them) in a way that makes them money rather than open the field to third-party distributed solar that will reduce demand and thus lower their revenues.

      That is why I keep saying that we cannot move to a more intelligent, cleaner, less costly energy system unless we provide an economically healthy role for the utilities. Otherwise they will do everything possible to keep the outdated, inefficient, higher cost system in place.

Leave a Reply