The SOL Disaster

by John Butcher

The 2023 test results (generally called “SOLs” but including results of other tests) are up on the VDOE Web page. Those numbers are not pretty.

First, some background.

2020 was the first year without statewide SOL testing since 1997. Then came 2021, when participation in the testing was voluntary. The VDOE press release (link now broken) said, “In a typical school year, participation in federally required tests is usually around 99%. In tested grades in 2021, 75.5% of students took the reading assessment, 78.7% took math, and 80% took science.”

So, the ‘22 data are the first post-pandemic numbers with a claim to measuring anything beyond individual performance.

The figures below omit the ‘21 data that can clutter the graphs without adding any useful information.

Further, economically disadvantaged students (here, “ED”; primarily students who qualify for the federal free lunch program) underperform their more affluent peers (“Not ED”) by around twenty points, depending on the test. This renders comparisons of the school and division and state averages meaningless because of the varying percentages of ED students. Fortunately, the VDOE database offers data for both groups. Hence the more nuanced analyses below.

With that out of the way, let’s start with the reading tests and the state averages.

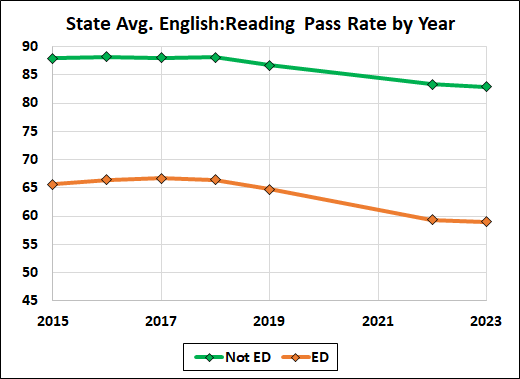
The 2022 results were a disaster for both groups, especially for the less affluent group. Indeed, those results are worse than these numbers suggest: As VDOE said in its press release:

The pass rates are even more alarming when considering the large number of students who are in the “low proficient” level and would have likely failed the SOLs under the 2018-2019 cut scores. Proficiency cut scores were lowered between the 2018-2019 and 2020-2021 test administration. These lowered cut scores enabled students to pass that would not have otherwise received a passing score.

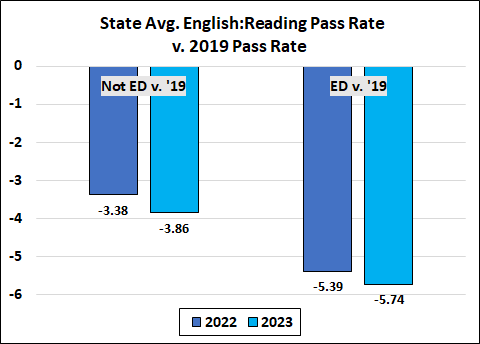
Rather than showing improvement since 2022, the 2023 results reveal deterioration.

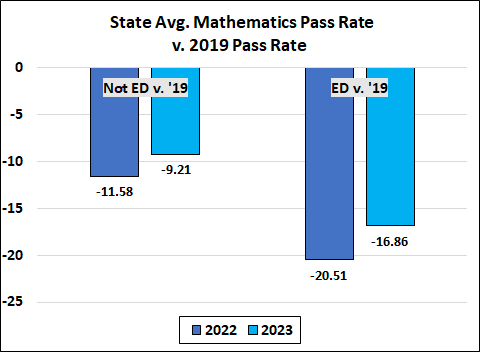
The math data are both better and much worse. The numbers rose in ‘19, thanks to a relaxation of the standards, but then plummeted.

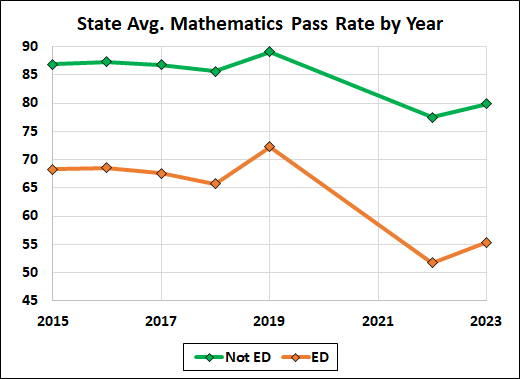
Even with the 2023 improvement, the pass rates are dismal compared to the ‘19 rates.
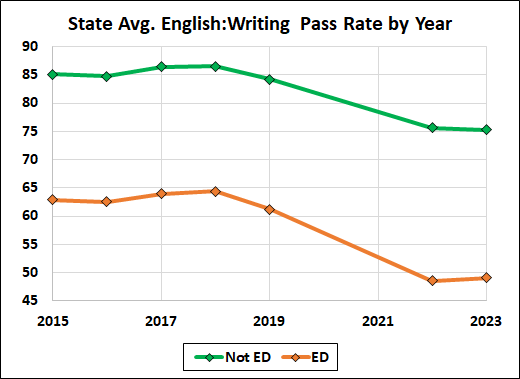
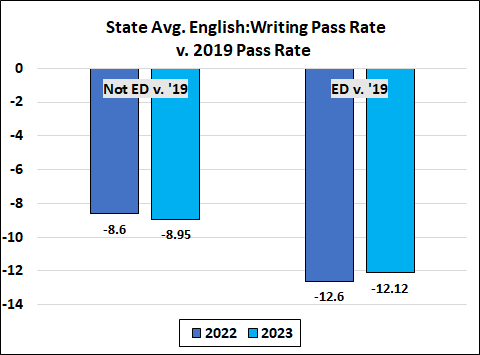
Next, writing:

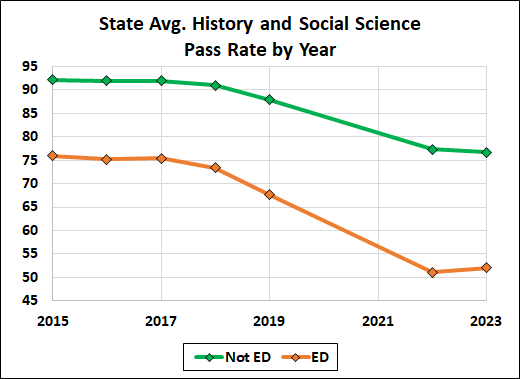
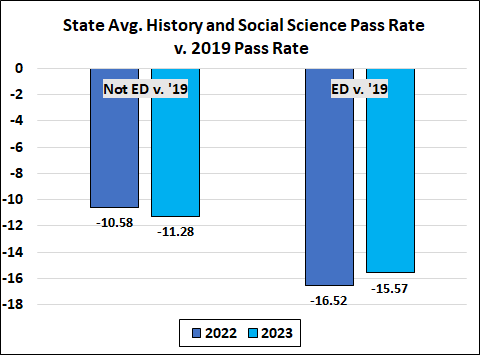
History & social science:
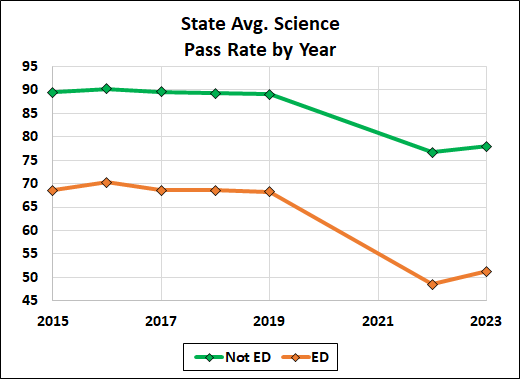
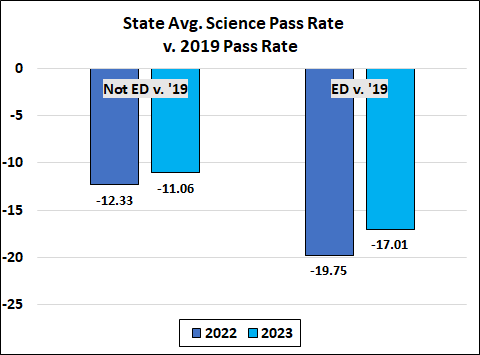
Finally, science:

Stay tuned for some more detailed results.

Republished with permission from Cranky’s Blog. 


Share this article


ADVERTISEMENT

(comments below)


ADVERTISEMENT

(comments below)


Comments

15 responses to “The SOL Disaster”

  1. vicnicholls Avatar
    vicnicholls

    and the D’s got extra $$$ to pay for more of this crap?

    1. Not Today Avatar

      What are you on about? The pandemic spanned two administrations. Neither has had a handle on how to deal with student learning loss. EVERY state, administered by BOTH parties, is dealing with the same thing. In some of them, it’s even worse because their standards were lower/abysmal to begin with.

      1. LarrytheG Avatar

        Yes. Cranky makes really “good” charts about “disasters”.

        Beyond that ? The point?

        and yes, Virginia is by far not the only state and NAEP results INCLUDE non-public schools.

        Before NCLB, there was much less “reporting” – almost none for some states…

        An assumption that public schools are “failing” is one of those half glass things.

        Anyone who wants perfection from public school or for that matter, private schools, is, IMO, not living in the real world.

        So what’s the point of hammering on the issue especially if the “solution” is not really stated or claimed to be “choice” schools which are largely less transparent nor accountable compared to public schools.

        We have required transparency for public schools.. and critics use this data to impugn the concept of public school basically claiming that publically-funded private schools with less transparency is the “solution”.

        Let ‘s just scrap the SOLs and NAEP and go with taxpayer-funded private schools with no accountability.

        that’s the ticket!

      2. James Wyatt Whitehead Avatar
        James Wyatt Whitehead

        The solution for secondary education is in plain sight and has been practiced at Fork Union Military Academy for over 70 years. The One Subject Plan would immediately deliver results.
        https://uploads.disquscdn.com/images/48d99e8b2d30c248f8ba898b49570b3e41432f588b238bbc808559e135fb4cf3.jpg

  2. James Wyatt Whitehead Avatar
    James Wyatt Whitehead

    The cut scores are so low now. Do these numbers really tell us anything about the real state of education in Virginia? Why bother with SOLs if it is the intention of the VDOE to scrap excellence all together.

      1. f/k/a_tmtfairfax Avatar
        f/k/a_tmtfairfax

        Just offering a few more data points.

        1. LarrytheG Avatar

          yep and thank you. Are the scores for the Charters also there? Do the Charters in NC generally
          do better than the public schools?

          1. f/k/a_tmtfairfax Avatar
            f/k/a_tmtfairfax

            According to the NC Department of Public Instruction, Charter schools are subject the same report card process as traditional public schools.

  3. It looks to me like English, History, and Science scores were starting a downward trend even before the pandemic debacle.

    It’s hard to tell whether the same was true for math since the minimum passing score was lowered in 2019.

    1. In 2022, Virginia’s 4th Grade average Math scores ranked 21st in the country.

      Still [a bit] above average & median, but quite a decline since 2019 when Virginia’s 4th Grade average Math scores were #4 in the nation.

      An eleven point drop in average scores between 2019 and 2022. And 2023 was no better.

      https://www.nationsreportcard.gov/profiles/stateprofile?chort=1&sub=MAT&sj=AL&sfj=NP&st=MN&year=2019R3

      1. LarrytheG Avatar

        yes… I revised an earlier comment when I took a look and remembered it had declined. Now in the lower 3rd of the country. Don’t know if this is “noise” or a serious decline. This is across Virginia and includes non-public schools.. Is it across the board or are some districts dropping so much that they are affecting the overall scores for NAEP and SOLs?

        IF we did a school district by school district, would they all show similar declines ?

        Do we REALLY understand what is going on?

        CRANKY is pretty handy slicing and dicing data…he probably could generate a district by district table with a 5 year timespan or some such,

        I wonder if the terrible scores for districts with high numbers of ED kids is pulling down scores overall,

Leave a Reply