The Other Side of the “Intensifying Rain” Claim

Prepared by Kip Hansen. Data sources cited. Click for larger view.

by Steve Haner and Kip Hansen

With the rainy remnants of another hurricane heading for Virginia from battered Louisiana, the stories of a coming Climate Armageddon will again ramp up. A couple of good examples of what to expect recently appeared in Virginia Mercury, the main one quoting numerous sources claiming Virginia is seeing more and more intense rainfall and will suffer more flooding as a result.

Don’t accept that on the slim evidence presented without paying close attention to what you are not being told. The facts omitted are often the main problem with the Climate Armageddon Narrative, which usually avoids outright falsehoods but regularly ignores adverse evidence.

The most powerful assumption in government right now, whether in Washington or Richmond, is that the Climate Armageddon Narrative is fact-based. It is instead based on models. A recent state-sponsored report which also warns of more and more intense rainfall, quoted by the Mercury, relies heavily on models and totally ignores how they usually offer a range of predictions. The report focuses only on the more dire of those predictions, not those which merely extrapolate historical trends. (More on that in a second story on sea level rise.)

NOAA National Centers for Environmental Information. Click for larger view.

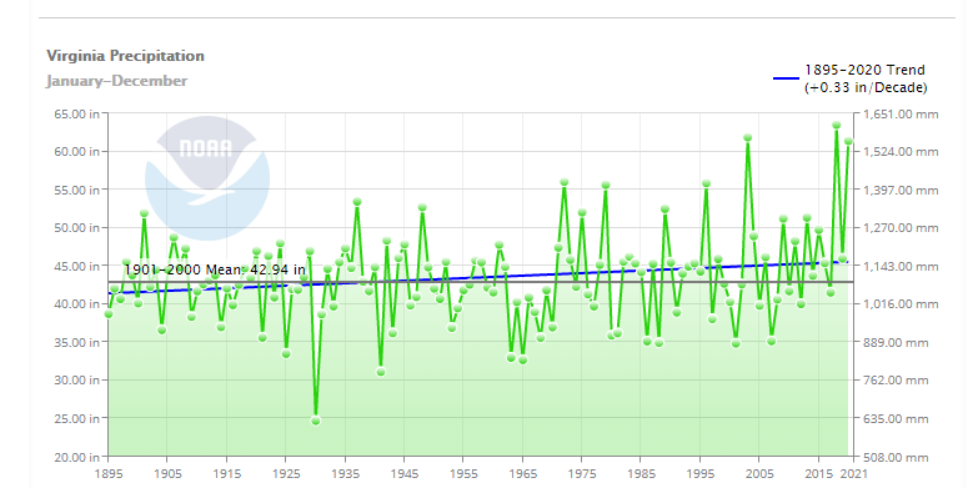
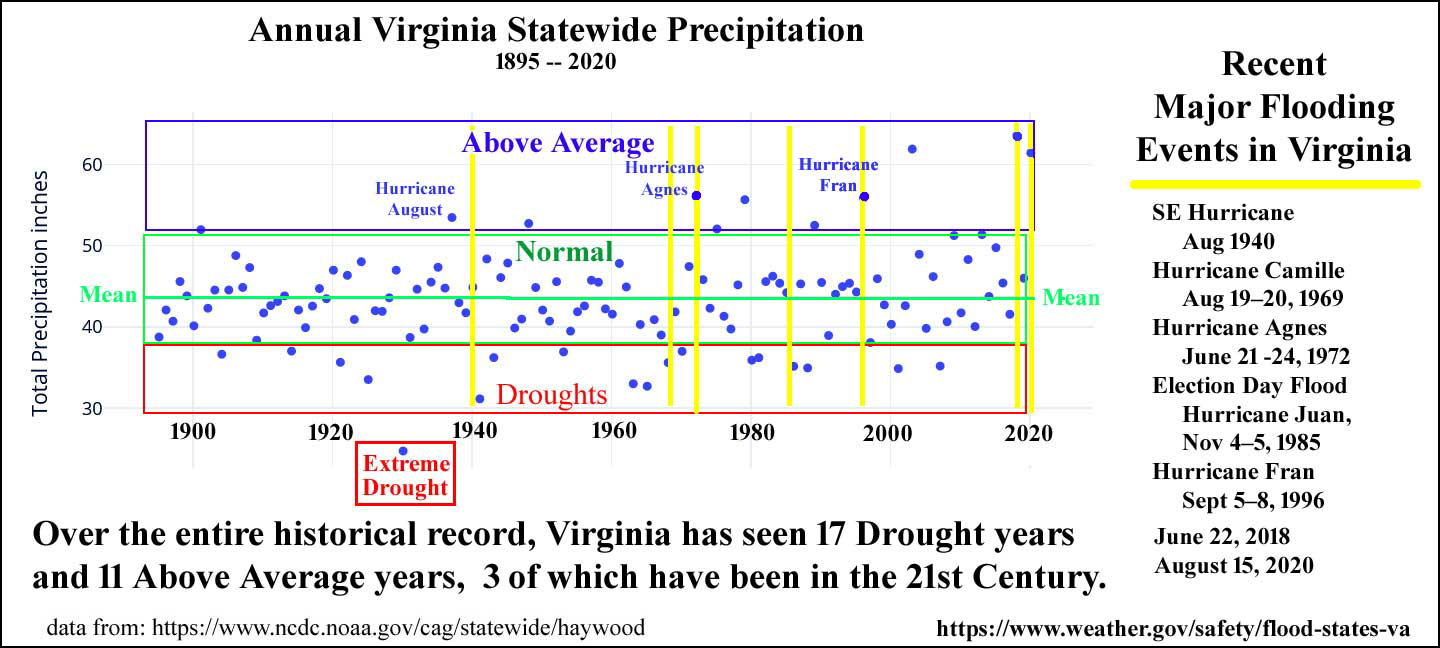
On rainfall a data trend is claimed. The Mercury article uses a chart to illustrate 125 years of rising rainfall total for Virginia, indicating about a third of an inch of added rain per decade since 1895. The chart was produced by NOAA but not used in the state report. Perhaps even the state report’s authors were leery of it.

Here is another look at the same data which produces a very different impression. First, unlike NOAA, it showed total rainfall. By starting its illustration only after the first 20 inches of rain per year (when each year starts at zero), NOAA’s visual is an intentional distortion.

Prepared by Kip Hansen. You can still see a bit of a recent upward trend, but far less dramatic. The 50-inch line is just a visual reference.

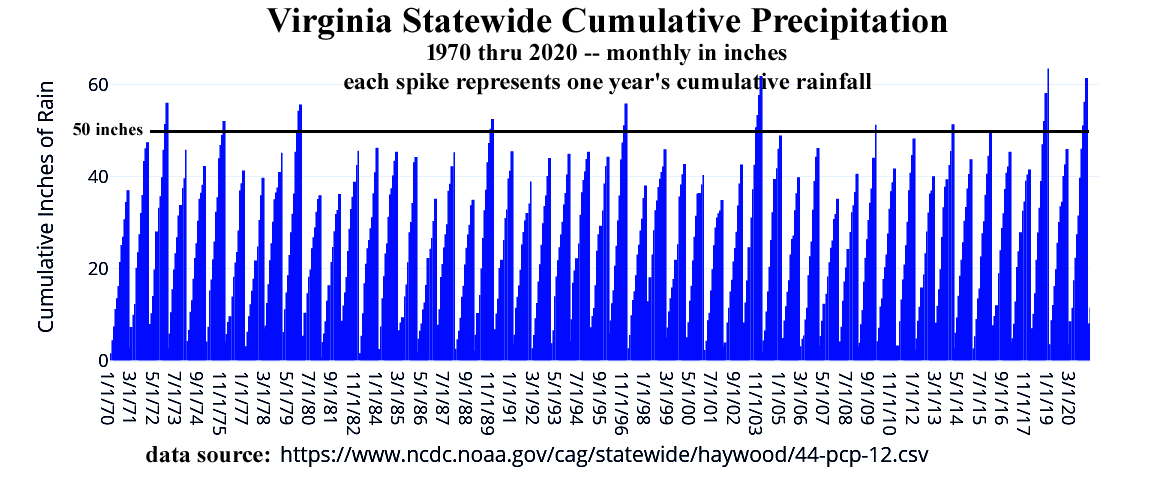
Your eye sees much larger gaps from the peaks to the valleys, and from the bottom of the chart to the top, on the NOAA version. The claimed upward slope of 3.3 inches per century (per century) looks more alarming. Everything looks very different when the annual rainfall totals start at zero and accumulate by month. This counter illustration prepared by co-author Kip Hansen only goes back to 1970.

Surely one of the most intense rainfall events in recent Virginia history was the downpour that destroyed much of Nelson County as the remnants of Hurricane Camille passed in 1969. There was no official rain gauge at that location, and the estimates of 20 plus inches of localized rain that night are merely that – estimates. The modern doppler weather radars didn’t exist then.

Those radars have now provided about three decades of reliable measurements on rainfall intensity. More data, and perhaps those claims can be sustained in future years. But the claims in the Mercury article are anecdotal or rely on one (Norfolk) or only some (see below) of the official measurements in the state.

How many other times have outlier events such as an isolated cloudburst evaded official measurement? Or areas of drought? Certainly it happened far more often a century ago than now. Comparing rainfall now with the records of 100 or 125 years ago is simply not valid. Even if you did have 100 years of hard state-wide data, would that truly provide a definition of “normal”?

Decades ago, expensive flood control projects have been installed in Richmond and the small industrial city of Buena Vista. Wouldn’t that indicate this is not a new concern? How often are they used? Is that pace accelerating? The absence of that evidence proves nothing but does raise questions.

To bolster its claims of coming monsoons, the Mercury cited a study that used data from 43 weather stations and found evidence of more rainfall and rainfall that was more frequently intense. The authors looked at 1947 to 2016 because when they looked at 1987 to 2016, “due to the heterogeneity in precipitation and limited statistical significance, these results are not shown.” Translation: For the most recent 30 years, nothing statistically significant was found. This, too, is contrary to the Mercury’s thesis.

Also, note only 43 of the 146 Virginia weather measurement locations had sufficient data to go back to 1947.  These authors at least are fairly cautious, concluding, “Over the 70-year period (1947 – 2016), mean annual precipitation in Virginia seems to have increased.” (Emphasis added.) The word “seems” never appears in the Climate Armageddon Narrative. Yet claims are being made elsewhere about trend lines back to 1895, using them to create concern about the future.

How about the other side of the equation? If next year is a drought year, what will that do to that trend line so crucial to NOAA’s claim of greater and greater rainfall amounts? Lack of rainfall can also be truly life- or economy-threatening, and might scare some Virginians more than 3 added inches of average annual rain.  

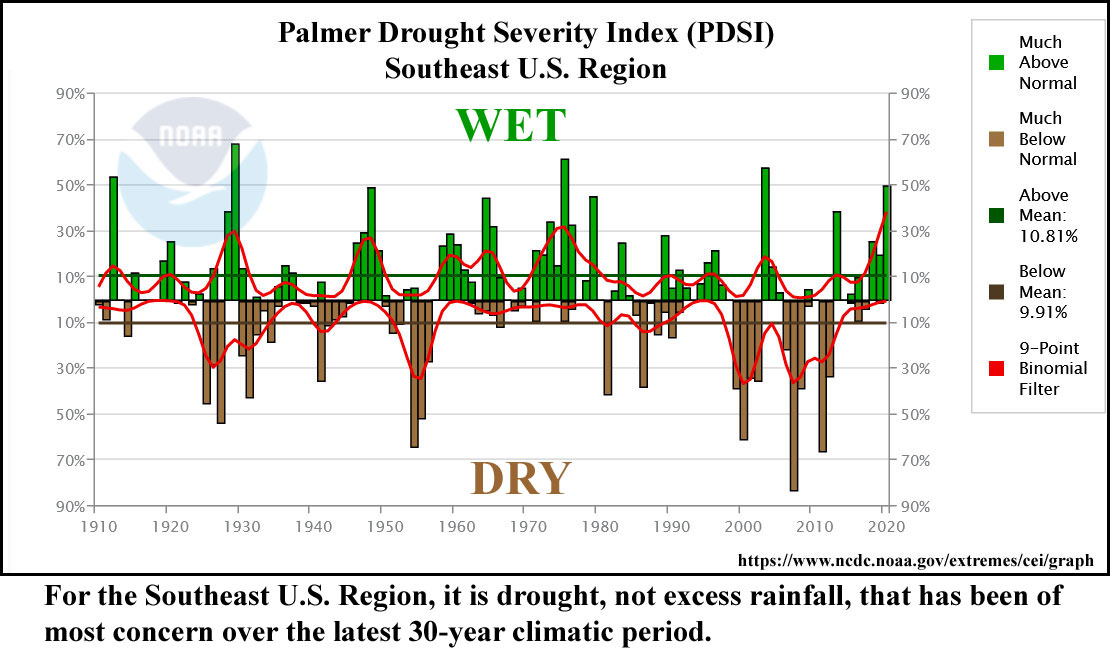
Yet another huge inconvenient fact: As we are discussing those recent rainy years, about half of Virginia this summer was in in dry or drought conditions. (See illustration at the end.) Check out the Palmer Drought Severity Index for the southeastern United States for the past 30 years. You won’t see a hint of warning there that the scale has tipped toward excess rain, just the normal rise and fall around the mean.

Prepared by Kip Hansen

The bottom line of the Mercury report and the state document is a warning that Virginia is not ready for major flooding events. This is correct, and it doesn’t matter whether the events come more frequently, less frequently or at the same pace as the past few decades. This is an engineering and land use challenge that should be taken up whether or not you lie awake nights listening for pounding rain. It is not due to climate change.

Kip Hansen is an experienced analyst and writer on issues of climate and human-caused climate change. Found as a I was seeking a volunteer consultant to help with my response, he added several points to my argument and prepared several illustrations. He deserved more than a “hat tip.”


Share this article


ADVERTISEMENT

(comments below)


ADVERTISEMENT

(comments below)


Comments

35 responses to “The Other Side of the “Intensifying Rain” Claim”

  1. Steve Gillispie Avatar
    Steve Gillispie

    Great presentation.
    I have been told that Climate and Weather should not be conflated; but I understand why people who believe mankind has only 10 years left or those whose businesses profit greatly from climate-change policy and investments would feel justified in using any means or distortion to win the day.

    1. Stephen Haner Avatar
      Stephen Haner

      I do expect that drought map will change in Virginia after the hurricane remnants do their thing. It is these tropical events that create those high rain totals from time to time. And since they often focus on the western parts of the state, it remains very possible that the records 100 years ago didn’t fully reflect their impacts.

      It is not that there is no evidence that rainfall may be increasing. But about three recent outlier years is the main basis for the claim, and three years out of 125 doesn’t make a trend. Contrary data were not even considered.

      1. Even if rain levels have been increasing in recent years, how do we know that it’s not part of a recurrent oscillation that has nothing to do with global warming? Thirty years of data doesn’t tell us anything.

        1. LarrytheG Avatar
          LarrytheG

          re: how would you know?

          Well, there are scientists who are actually educated in the science and there are ordinary folks looking at data they may well lack the expertise to truly analyze and discern.

          And once you don’t trust the science and make your own conclusions, we have what we have now.

          which is folks who still trust the science and folks who do not and come up with their own conclusions.

          1. DJRippert Avatar
            DJRippert

            “And once you don’t trust the science and make your own conclusions, we have what we have now.”

            The question isn’t whether to trust the science. The question is whether to trust the scientists, especially government scientists.

          2. LarrytheG Avatar
            LarrytheG

            even if many/most of the non-government scientists also agree?

            then what?

            It’s a conspiracy of liars and such?

          3. DJRippert Avatar
            DJRippert

            In my case, as has been publicly described … I believe climate change is real. That certainly does not mean that I trust anything and everything being said … by scientists, politicians or anybody else.

            https://www.baconsrebellion.com/anthropomorphic-global-warming-is-real-now-what/

          4. LarrytheG Avatar
            LarrytheG

            So to what do you attribute your belief that it is real especially if you do not trust govt scientists?

            Who DO you trust to believe that climate change is real?

          5. DJRippert Avatar
            DJRippert

            I read material from people (including, but not limited to, scientists) and make up my own mind.

            Want to read some doomsday predictions from scientists in the past?

            https://www.aei.org/carpe-diem/50-years-of-failed-doomsday-eco-pocalyptic-predictions-the-so-called-experts-are-0-50/

            1970: Ice Age by 2000
            1978: No End to 30-Year Cooling Trend
            1989: NYC’s West Side Highway Underwater by 2019
            2004: Britain will be Siberia by 2024

            Probably good that most people didn’t blindly believe this nonsense.

          6. LarrytheG Avatar
            LarrytheG

            wait.. you’re giving me an AEI link? 😉

            yes, scientists are wrong – all the time – often and usually one-off “studies” of one sort or another but when a shitload of them have warnings… it’s reall dumb to bet the farm. It’s actually a most UN-Conservative thing to gamble it all that so many of them would be so wrong – and to justify it by saying they’re all lying or colluding ….

            would one be this way on ANY science? Cancer? Genetics? astronomy, etc?

            When a strong majority of science says bad things are possible – I do not discount it. I have no idea what will happen and do realize it could be anything from zero change to even worse change that we think.

            I just don’t discount “science” writ-large as a whole on ANY science.

        2. Eric the half a troll Avatar
          Eric the half a troll

          I’m terms of hydrology, 30 years of data is fully sufficient to establish trends.

    2. Eric the half a troll Avatar
      Eric the half a troll

      The profits to be made by denying climate-change dwarf the profits to be made… pretty much by anything else… except maybe killing other human beings through violence…

  2. Nancy Naive Avatar
    Nancy Naive

    It’s all the rain coming on the weekends.

  3. LarrytheG Avatar
    LarrytheG

    here’s an interesting run-down of hurricanes in Richmond:

    Hurricanes Influencing the Richmond Area

    http://www.glenallenweather.com/alink/09hur/richmondhur.pdf

  4. FluxAmbassador Avatar
    FluxAmbassador

    Boy, if you don’t like models as the reason for making decisions I have some bad news about economics for you…

    1. FluxAmbassador Avatar
      FluxAmbassador

      For goodness sakes, right there in your lead image you can see that since 1980 droughts have been increasingly less common and less severe while significant rainfall events are staying at least steady in number but increasing in intensity.

      1. Nancy Naive Avatar
        Nancy Naive

        “I have a right to be blind sometimes. I really do not see the signal,” — Horatio Nelson, 1st Viscount Nelson

        1. LarrytheG Avatar
          LarrytheG

          We have non-scientists telling scientists they don’t know what they are talking about……..

          It’s sorta like telling your doctor you don’t like his analysis and advice and you tell him how to interprete the tests he has ordered.

          1. Nancy Naive Avatar
            Nancy Naive

            But Larry, Facebook says we’re all scientists now. Ten minutes on FB is worth years in the laboratory.

          2. LarrytheG Avatar
            LarrytheG

            It’s the “Smart People” thing. If someone has a “good” education , the internet can provide you with the data and it’s a simple matter to read through it and figure out that scientists are no better at it than you AND worse, they “lie”. So NOAA scientists LIE about the data… just like other climate scientists are lying – all for a politicol purpose even…

            So now for some folks, many scientists are little more than yet another leftist cabal with politicol agendas.

            It started with the ozone holes, then climate, and now with COVID…

          3. Nancy Naive Avatar
            Nancy Naive

            Meh, what’s the difference if we destroy the environment in the next 150 or 200 years, it’s all going to crash into the Sun in 4 billion years anyway. What more could man accomplish in between?

      2. Stephen Haner Avatar
        Stephen Haner

        Mr. “Flux Ambassador” (?), I don’t see how you can see intensity in that chart. Annual totals are not “intensity.” And it looks like 11 of the past 20 or 21 years were below the mean (which is a duh since that is what mean means…)

        1. FluxAmbassador Avatar
          FluxAmbassador

          Please, Mr. FluxAmbassador was my father!

          And two things:

          1) Annual totals aren’t intensity, true, but are a useful adjunct.

          And

          2) As displayed on the chart, below the mean does not by itself mean drought.

      3. …right there in your lead image you can see that since 1980 droughts have been increasingly less common and less severe…

        Not really. From the lead image (Annual Virginia Statewide Precipitation):

        There were 5 severe droughts in the 40 years between 1900 and 1940.
        There were 7 severe droughts in the 40 years between 1940 and 1980.
        There were 6 severe droughts in the 40 years between 1980 and 2020.

        This is no evidence of decreased drought frequency.

        And, apart from a severe outlier in the early 1930s, the median rainfall during the drought years was quite similar among the three periods (looks to be about 36-37 inches. It’s impossible to compute a precise mean without the actual total rainfall amounts, but you can draw a line across with half the drought dots above the line and half below it to determine an approximate median.

        It anything, that chart indicates that the period 1900-1940 had overall less frequent and less severe droughts than the other 40 year periods. There is also some indication that the period 1980-2020 had slightly less severe droughts (on average) than 1960-1980, but that they occurred at essentially the same frequency.

        There is certainly not enough data to conclude that “since 1980 droughts have been increasingly less common and less severe”.

        CORRECTONS MADE: 0840

  5. LarrytheG Avatar
    LarrytheG

    I agree some of this is probably overblown but don’t see where NOAA “purposely misrepresented”. We know that how?

    And agree, weather is not climate and the modelling is not the same.

    Also, you mentioned Camille – Did you not remember, Hurricane Gaston which dumped what, about 14 inches in 24 hours or so and wreaked havoc on Shockoe Bottom.

    I’ve read that 100 year and 500 year floods are now more frequent than their original metric.

    But I still find it a little odd that we disbelieve the science , NOAA, etc, but we use the data they collect and interpete it differently…almost as if science is interpreting their own data incorrectly or purposely fudging it..

    So, at least some science, seems no longer really trusted by some folks.

    1. Nancy Naive Avatar
      Nancy Naive

      P-a-r-a-n-o-i-a.

      Your adversaries always misrepresent. And equally, when someone presents something with which you disagree, they become your adversary.

      1. LarrytheG Avatar
        LarrytheG

        Ah… yes….. and then… the name calling? 😉

        1. Nancy Naive Avatar
          Nancy Naive

          Who me? I don’t take climate change personally.

          I suspect flooding has anthropomorphic causes. Not so much in climate changes as in stupid land management.

  6. Nancy Naive Avatar
    Nancy Naive

    When the last tree is cut, the last fish is caught, and the last river is polluted; when to breathe the air is sickening, you will realize, too late, that wealth is not in bank accounts and that you can’t eat money. -Alanis Obomsawin, filmmaker (b. 31 Aug 1932)

  7. Eric the half a troll Avatar
    Eric the half a troll

    If “the highs are getting higher” is the theory, then ignoring the lows in your data set is appropriate. Further, you don’t need a graph to decide the matter. Look at the data itself. I think Excel is your friend there.

    A good exercise would be to see if the lows are getting lower as well – pick a few stations.

    1. LarrytheG Avatar
      LarrytheG

      You can get the same amount over the year or decades,etc but the number of events and/or the intensity of the events can be different.

      There can be a fair amount to any anlysis beyond the total data.

      Consider something like the number of hurricanes per year – one might say in a year where there are less that it means less total damage or some such.

      Nope. A single hurricane like Sandy or the one in Houston can do several times the damage or several hurricanes.

  8. William O'Keefe Avatar
    William O’Keefe

    A very compelling presentation Steve in spite of the comments of True Believers who remind me of Marx brothers quote, “who are you going to believe, me or your lying eyes?” The lazy will look at media reports of the IPCC Summary for Policy Makers and ignore what scientists say in the full report.

  9. The bottom line of the Mercury report and the state document is a warning that Virginia is not ready for major flooding events. This is correct, and it doesn’t matter whether the events come more frequently, less frequently or at the same pace as the past few decades. This is an engineering and land use challenge that should be taken up whether or not you lie awake nights listening for pounding rain. It is not due to climate change.

    This is an important point which is being ignored as we argue back-and-forth about whether overall rainfall has increased a little, decreased a little, or stayed more-or-less the same over the last 100 years or so. And yes, I am also guilty of that.

    NN’s comment “I suspect flooding has anthropomorphic causes. Not so much in climate changes as in stupid land management. ” is apropos here. We have made major mistakes in the past managing storm water runoff, and we need to do better. Thankfully, the Commonwealth, as well as many [most?] counties and cities are taking the issue ever-more seriously and are more strictly enforcing storm water management requirements for new developments. However, we still have many existing runoff & flooding problems from the past which need to be addressed.

    So, now I am going to endanger my reputation as a small-government, low-tax, conservative-with-libertarian tendencies. Here goes: While I am no fan of new and ever-increasing taxes, I am not convinced that the “storm water taxes” proposed and in some cases implemented by some localities in recent years are a wholly bad idea. I think some localities have implemented them poorly and unfairly, but with certain conditions, I could support adoption of local “storm water taxes” in counties and cities in the Commonwealth. Some of these conditions are:

    1. The tax is computed based solely on the overall percent imperviousness of a given parcel.

    2. Discounts/credits are offered for installation and operating costs of on-site SWM facilities constructed by the property owner as long as such facilities are properly maintained.

    3. The money generated will be used ONLY on specific projects designed to correct/abate existing storm water runoff and flooding problems.

    4. Every new development must bear the whole cost of building and maintaining proper SWM facilities to handle the increased runoff associated with that development.

    5. Mechanisms are put in place to reduce or eliminate the tax as existing runoff problems are addressed and flood dangers are reduced.

  10. Peter Galuszka Avatar
    Peter Galuszka

    Who is Kip Hansen, exactly? Isn’t he associated with a denier blog?

    Also, why is there such an obsession here with the Virginia Mercury? I think they do a great job of providing coverage that newspapers no longer do. The Mercury doesn’t seem particularly obsessed with Bacons Rebellion. In fact, I don’t think I have ever seen it mentioned at the Mercury.

  11. […] noted yesterday, when evaluating the Climate Armageddon Narrative, one of the key steps is to ask what facts are […]

Leave a Reply