The Hard Truth about Virginia Schools

by James A. Bacon

Virginia’s public schools, once among the best in the nation, are slipping badly. Some of the learning loss can be attributed to school closings driven by the COVID-19 epidemic, but the slide began several years before, when education leaders began lowering standards. And despite a relentless focus on “equity,” the racial achievement gap is getting worse.

So concludes a report issued this morning, “Our Commitment to Virginians: High Expectations and Excellence for All Students,” prepared by Jillian Balow, Virginia Superintendent of Public Instruction.

The bulk of the report is devoted to documenting the seldom-acknowledged reality that educational outcomes in Virginia are deteriorating. “We need a clear understanding of where we are right now,” said Education Secretary Aimee Guidera in a press briefing before the official release. The report, she said, presents “a sobering picture.”

Bacon’s Rebellion will present the data behind that conclusion in this post, and then describe how the Youngkin administration intends to address the challenge in a follow-up post.

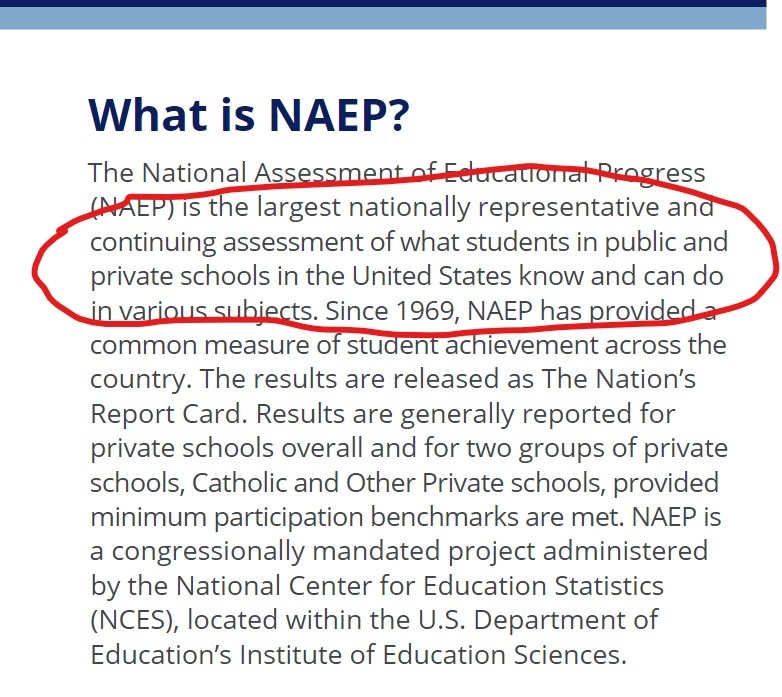
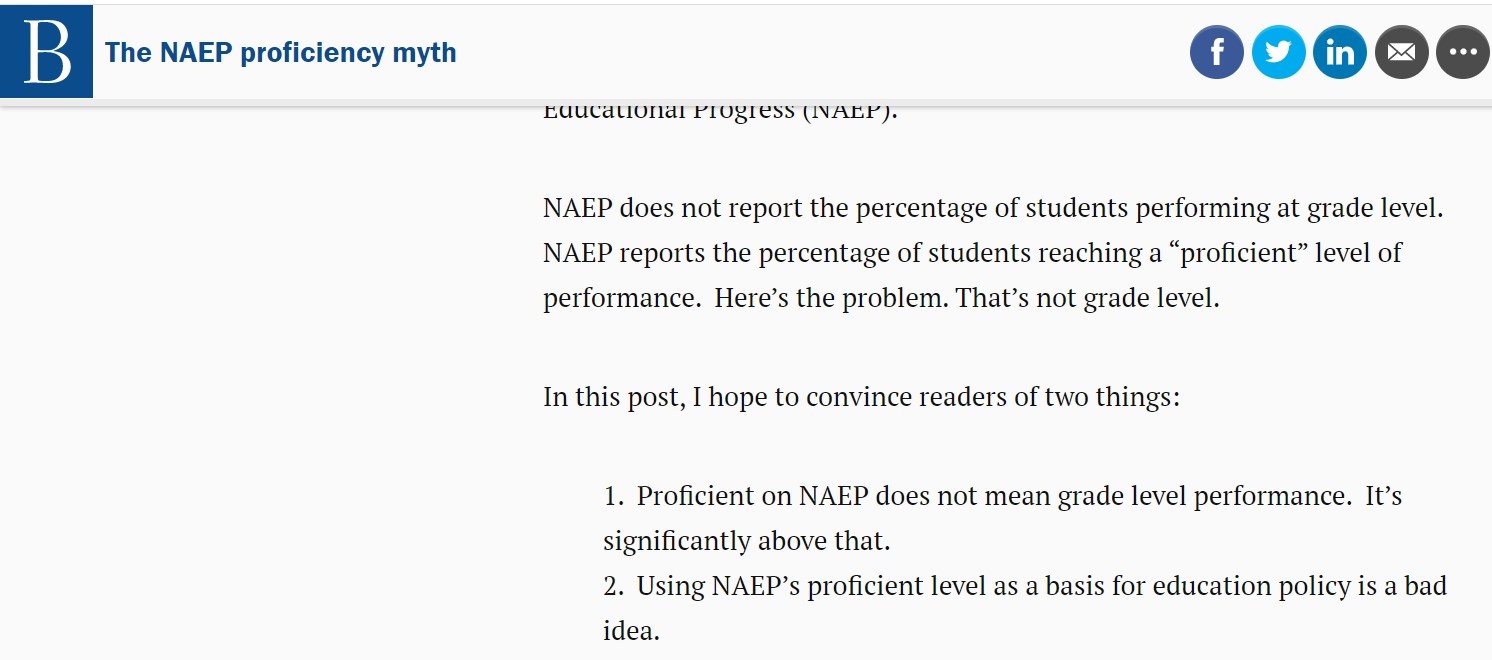
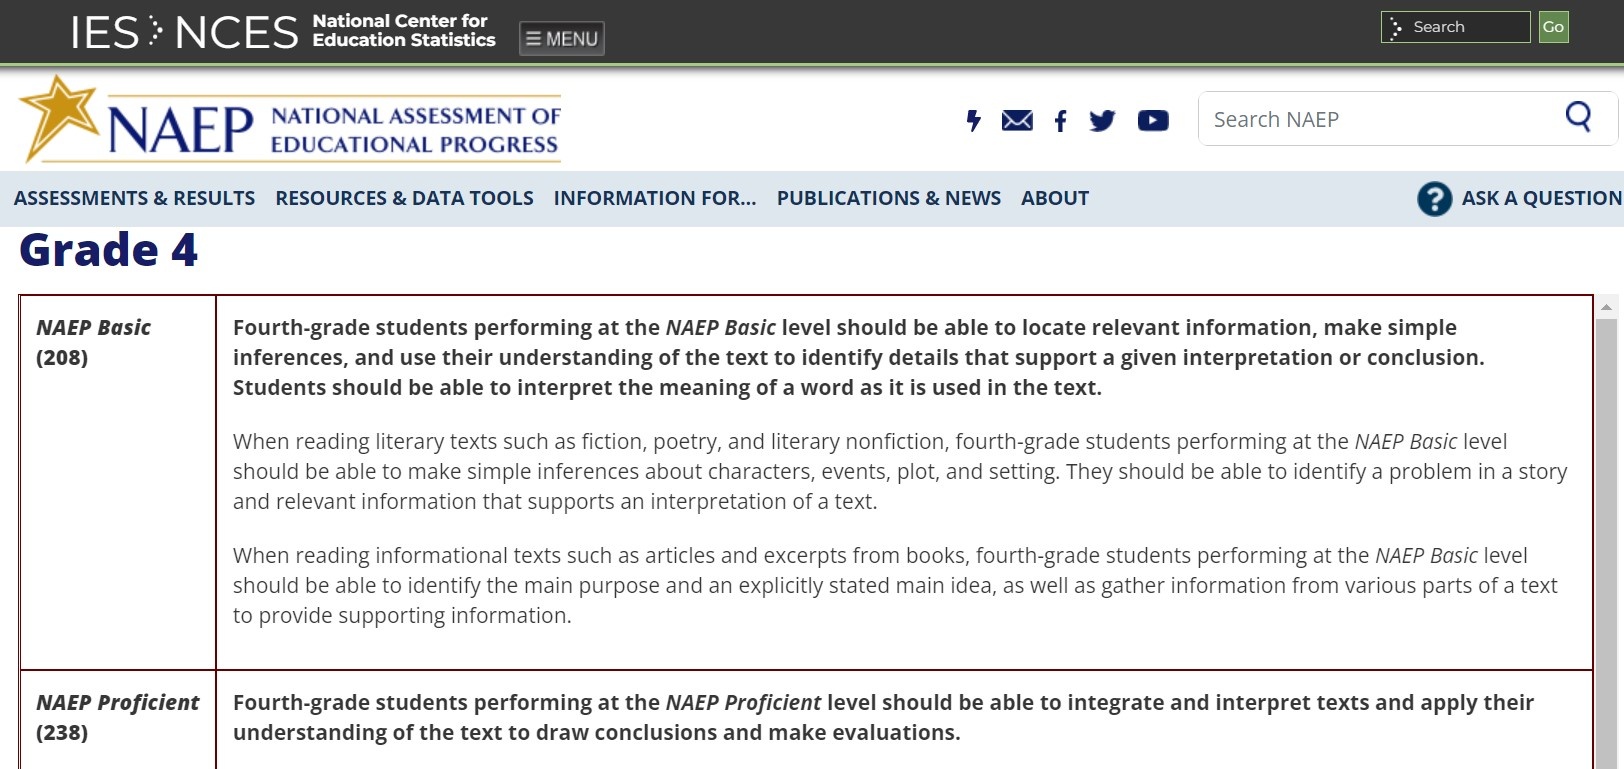
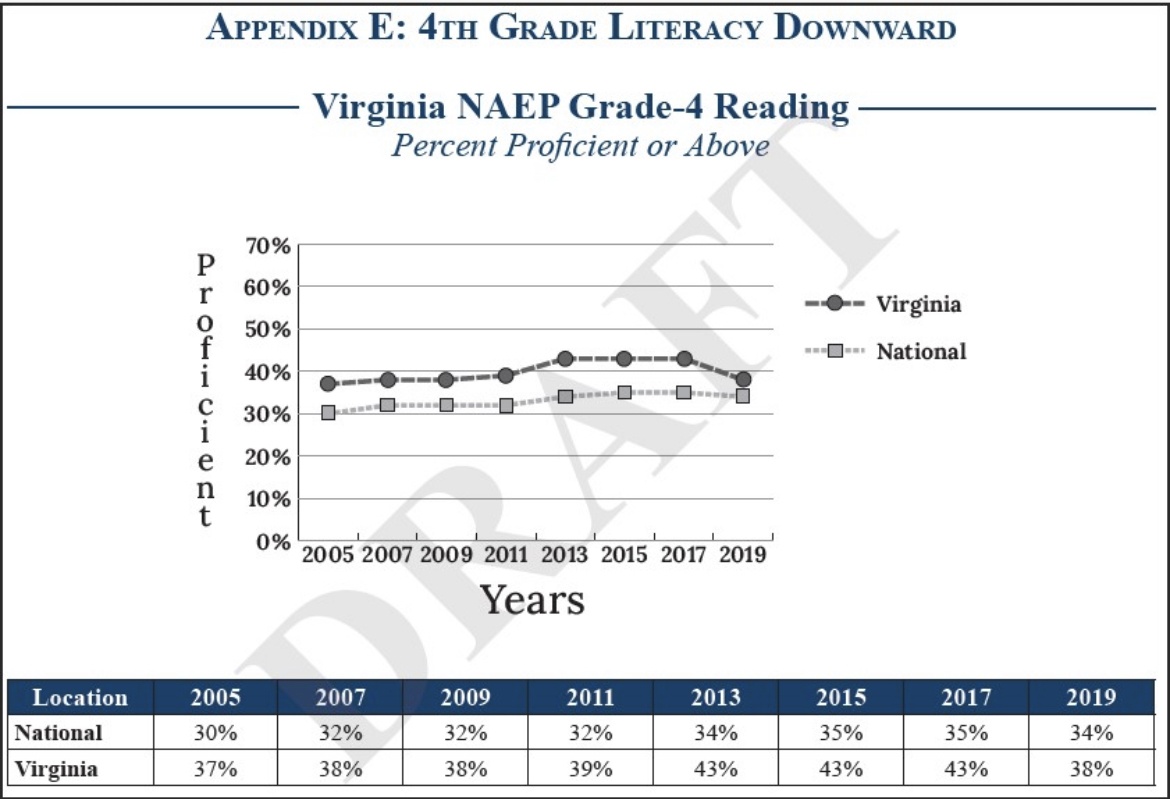
Central to the report is a concept called “the honesty gap,” a metric popularized by a nonprofit organization, Achieve Inc., to express the gulf between state and federal measures of student proficiency in math and English. According to Virginia’s Standards of Learning (SOL) tests, 75% of the state’s 4th graders are proficient in reading. But according to the National Assessment for Educational Progress (NAEP) — the “gold standard” in educational testing — only 38% are proficient, a gap of 37%. The discrepancy is even wider for Blacks and Hispanics: 45%.

This gap shows the discrepancy between the percentage of students in Virginia and the U.S. who score “proficient” in state and national assessments. The high Virginia percentages reflect lower standards.

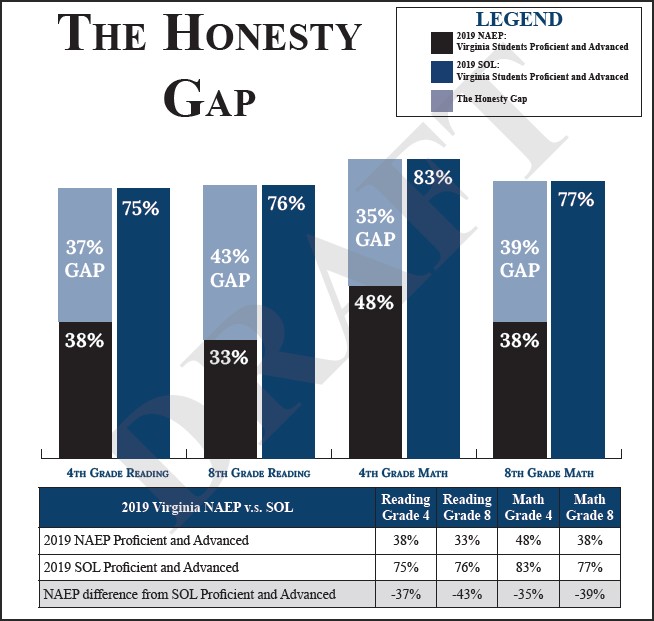
Virginia is one of only three states in the country — Georgia and Arkansas are the others — where the honesty gap exceeds 20 points.

“We’ve been telling parents, taxpayers, and teachers that our kids are prepared and OK when they’re not,” Guidera said. “We have to get the truth out to people.”

Virginia was one of the first states in the country to enact tests to measure student academic achievement in the 1990s, and it consistently bolstered standards through Republican and Democratic administrations for 20 years. The commonwealth developed a reputation as having one of the strongest systems of public education in the country, although the overall performance did mask severe achievement gaps in high-poverty schools. A sea change occurred in 2017 when the State Board of Education, motivated largely by equity considerations, lowered “cut” scores, or the number of correct answers it takes to demonstrate proficiency, for the Standards of Learning tests.

In the estimation of the Youngkin administration, lowered expectations and relaxed standards have contributed to a general decline in achievement along with widening gaps between racial groups. States the report: “Virginia is losing its national standing.”

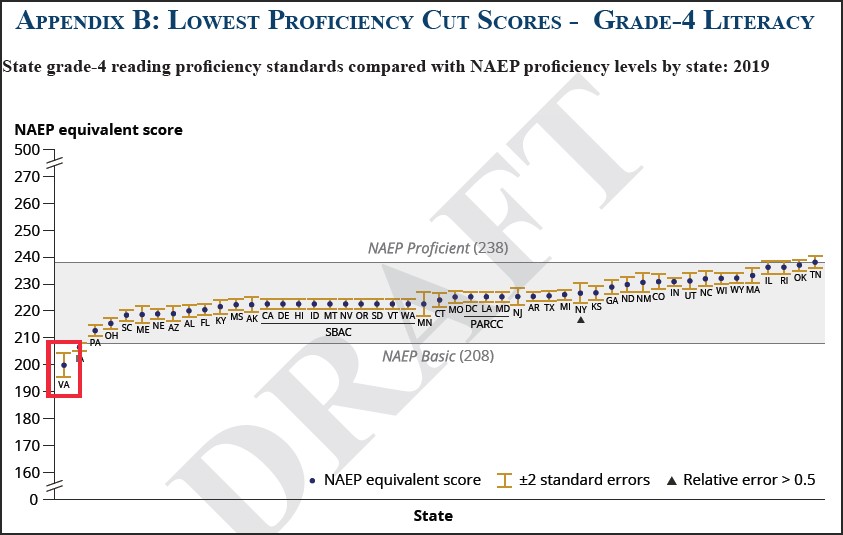
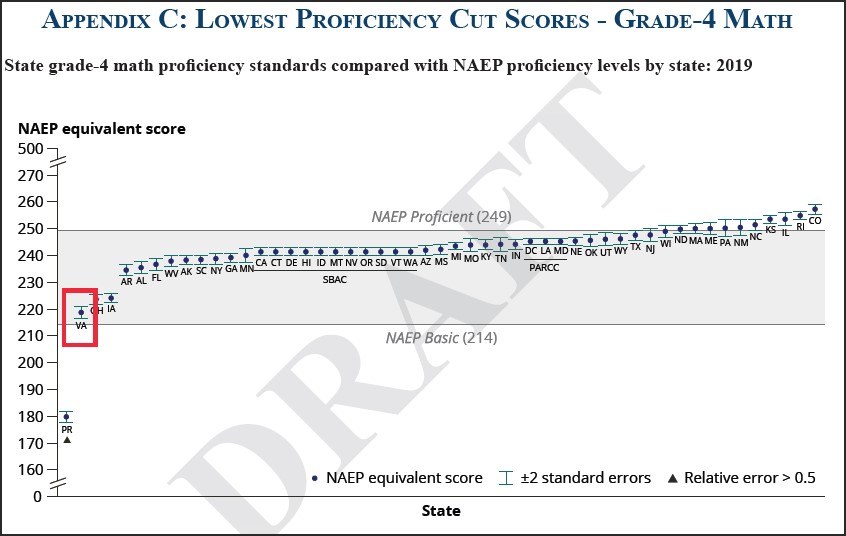
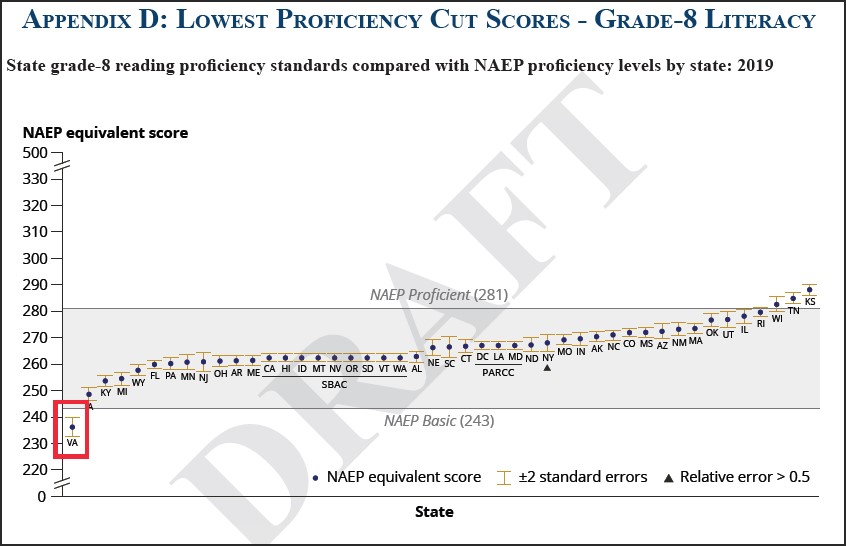
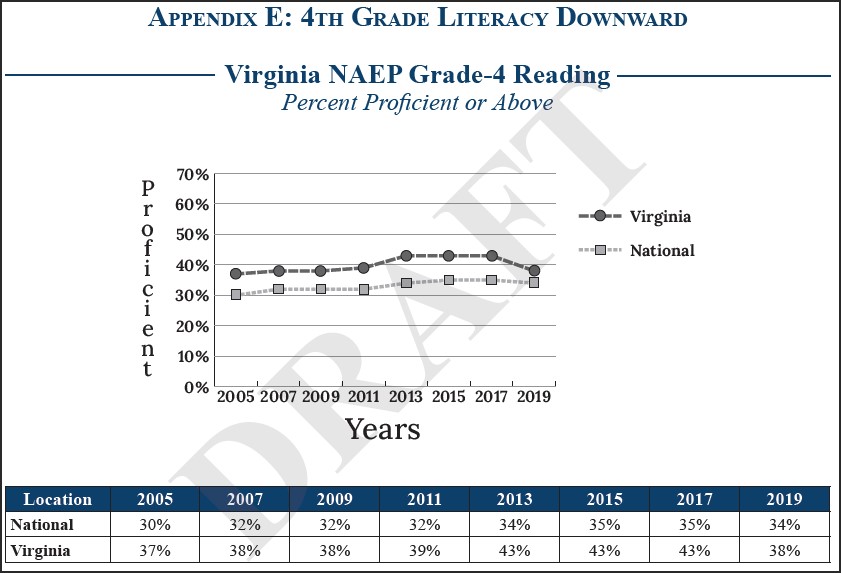
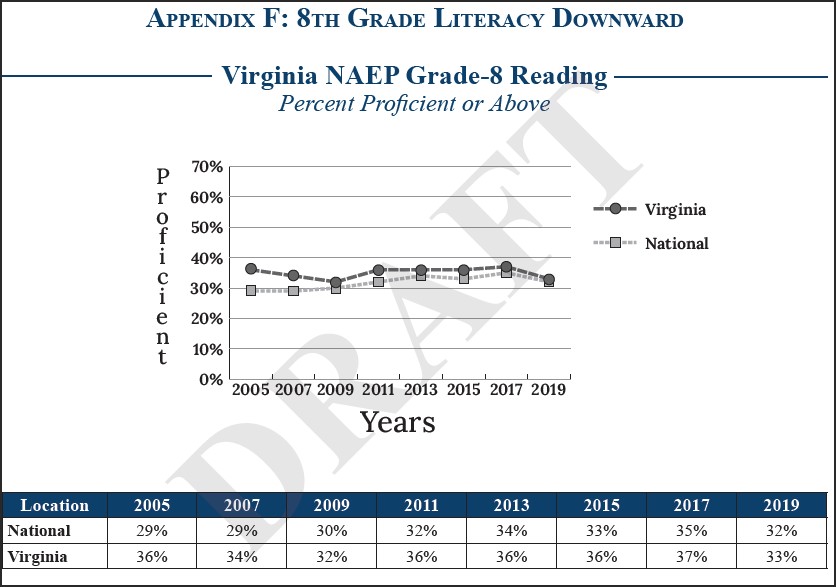
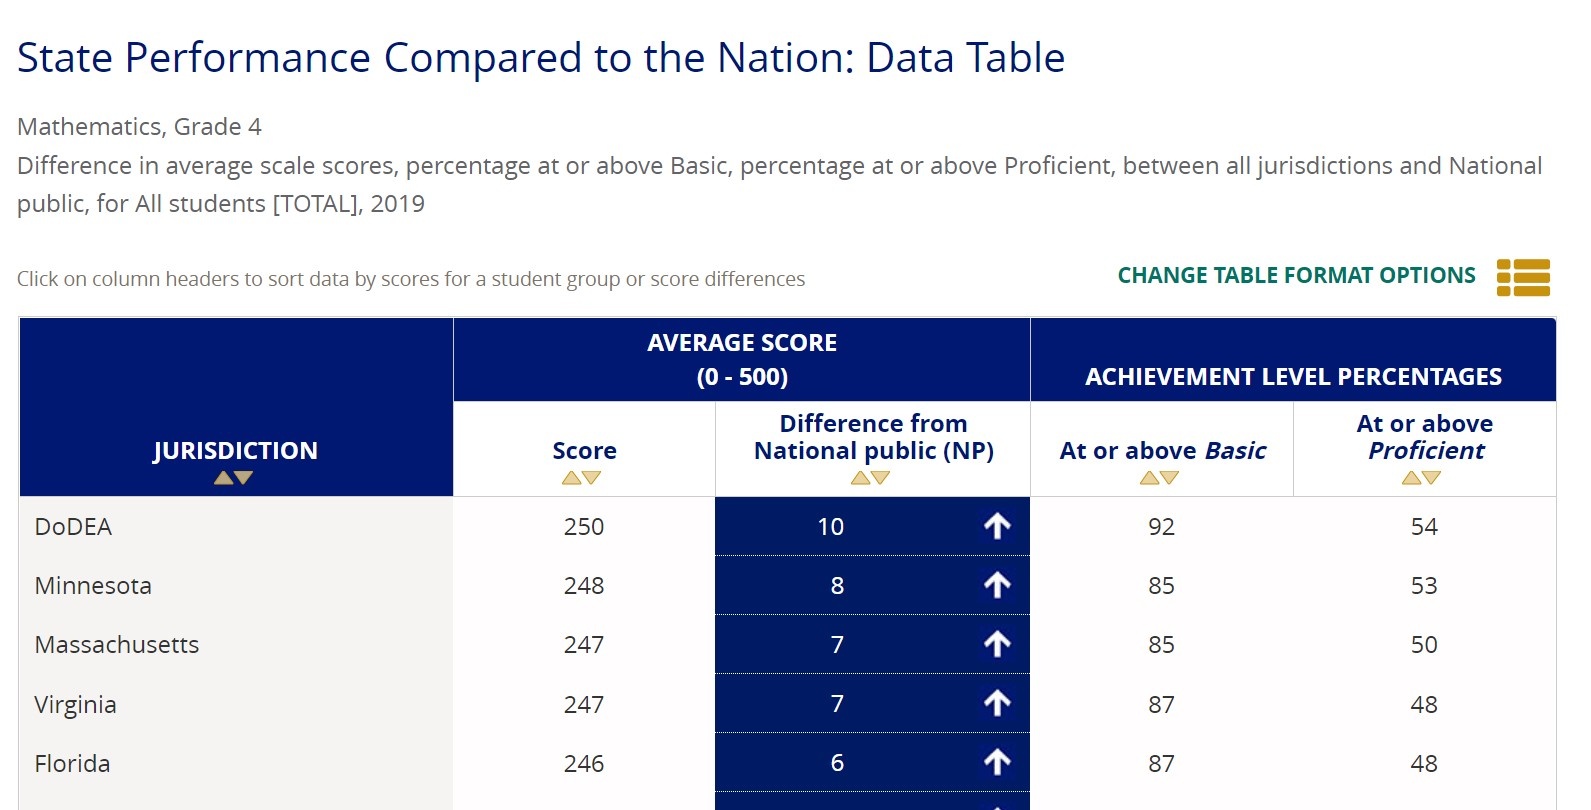
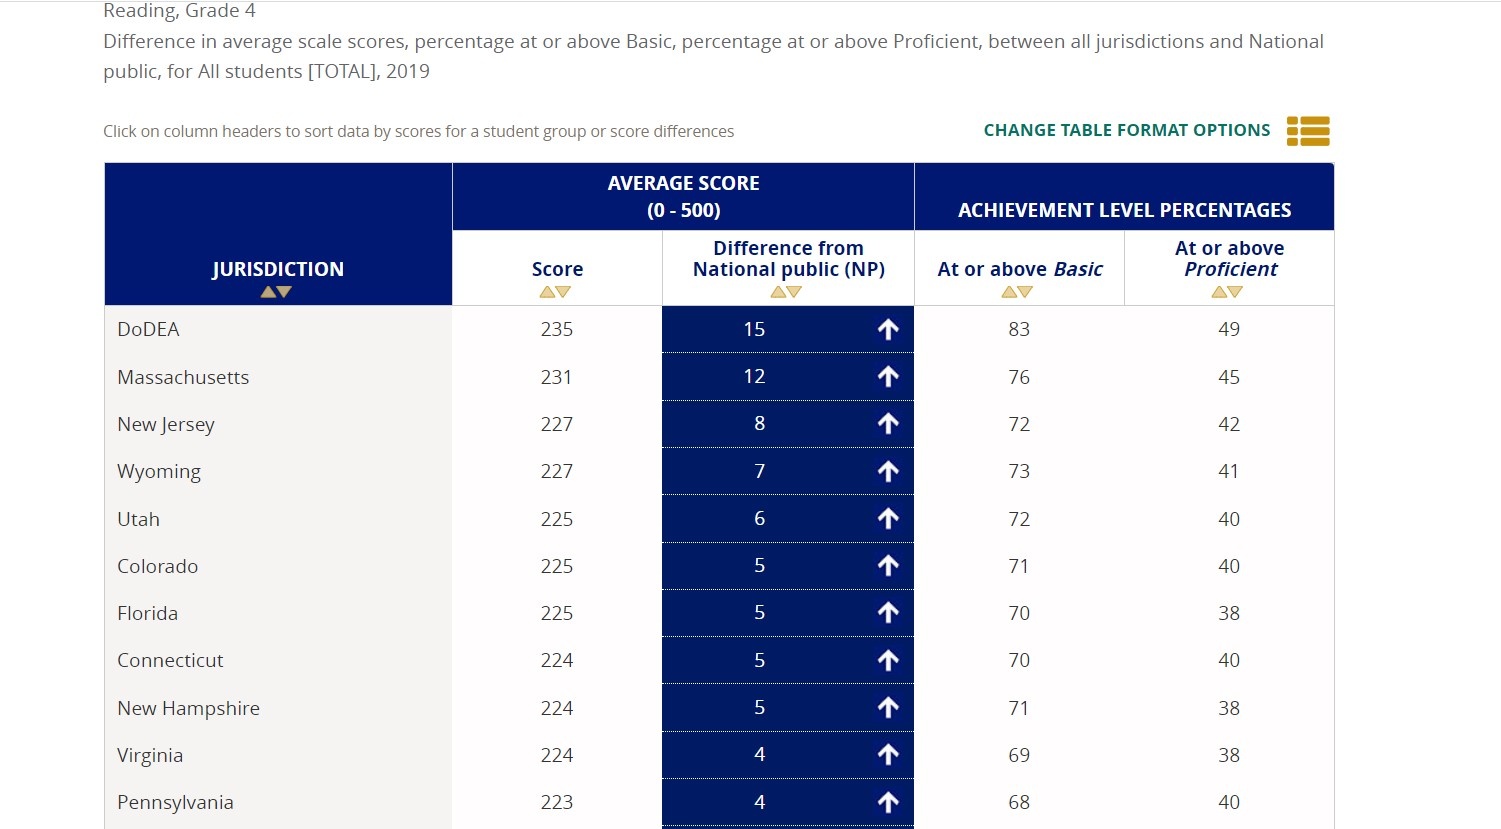
The following charts show how Virginia has the lowest proficiency standards of all the 50 states and Washington, D.C., as determined by NAEP.

While Virginia students fared better in the 2019 NAEP assessment (the most recent year the national tests were administered), the margin of superiority shrank considerably in reading compared to previous years, as can be seen in the following two charts. (Virginia’s lead narrowed less dramatically in math.)

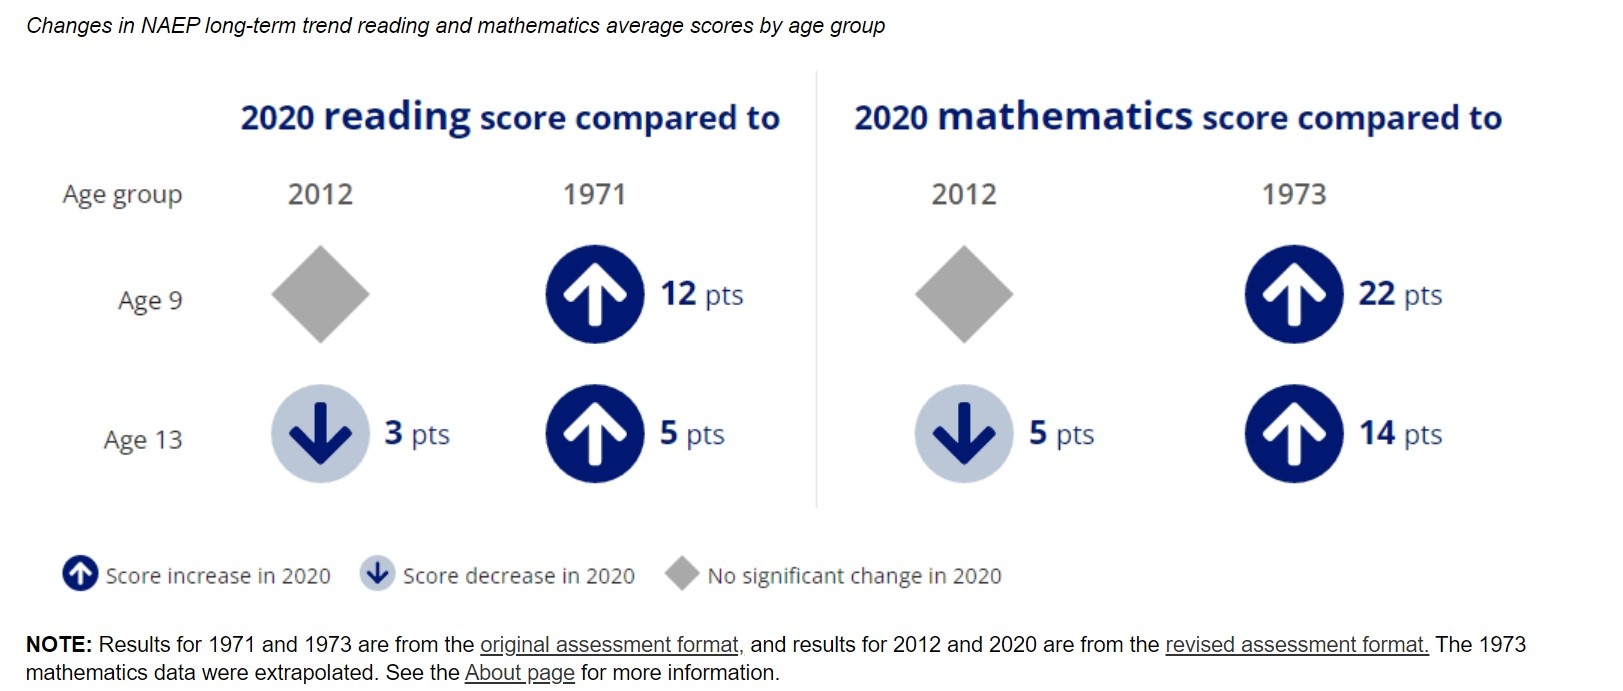
The NAEP data indicates that the erosion in performance was well underway before the COVID pandemic struck. The response to that event accelerated the downward trends. Virginia schools turned to remote learning instead of in-person learning to a far greater degree than other states. Virginia students received in-person instruction for 9.7% of the school year on average, the lowest of eleven states studied in one survey.

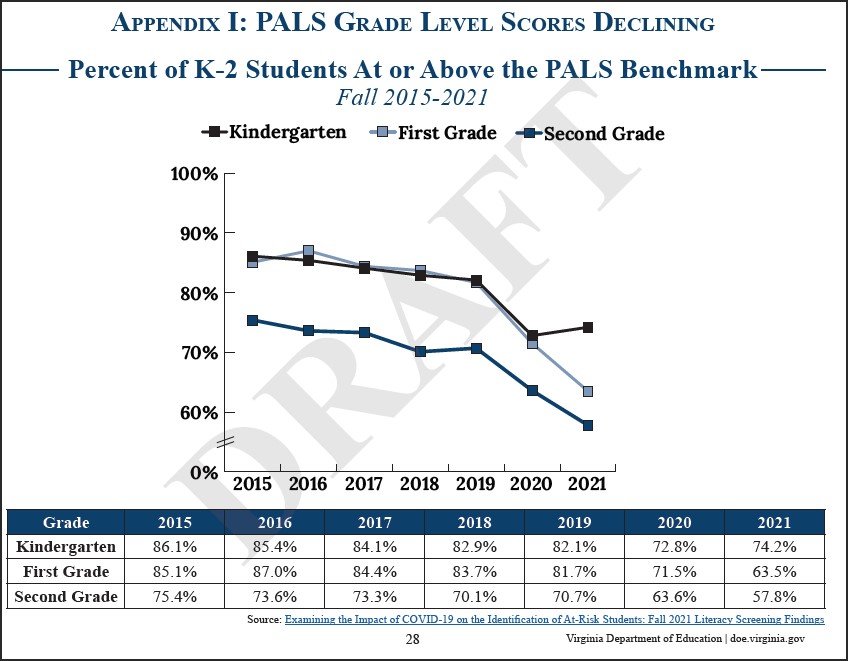
Schools administer a test to elementary school students, the Phonological Awareness Literacy Screener (PALS) in the fall and winter, to see how they are progressing during the year. Those scores have been in decline since 2016, but they plummeted during the pandemic, and in most cases failed to recover even when students returned to in-person learning in the current school year.

Another way of measuring progress through the school year is the Multi-Tiered Systems of Support (MTSS). The chart below shows the percentage of students reaching the math benchmarks. Between the winter of 2020-21 (midway through the school year) and the winter of 2021-22, the percentage of Virginia students above the benchmark declined 9% compared to a modest 2% decline nationally.
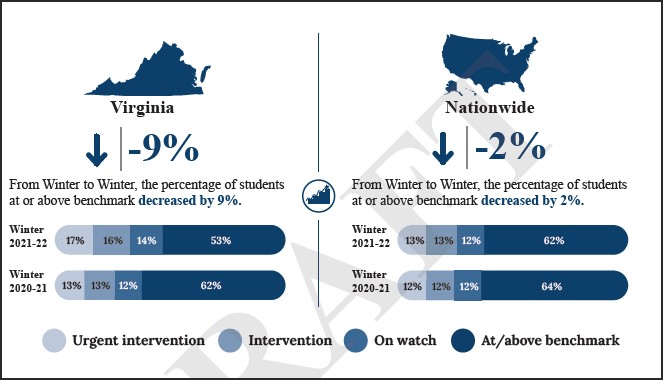
And for literacy….

The trends have been discouraging in upper grades as well, as measured by average SAT scores and ACT scores. Those college readiness scores have also been declining in Virginia, although comparisons are tricky because the percentage of students taking those tests varies significantly from state to state and year to year.

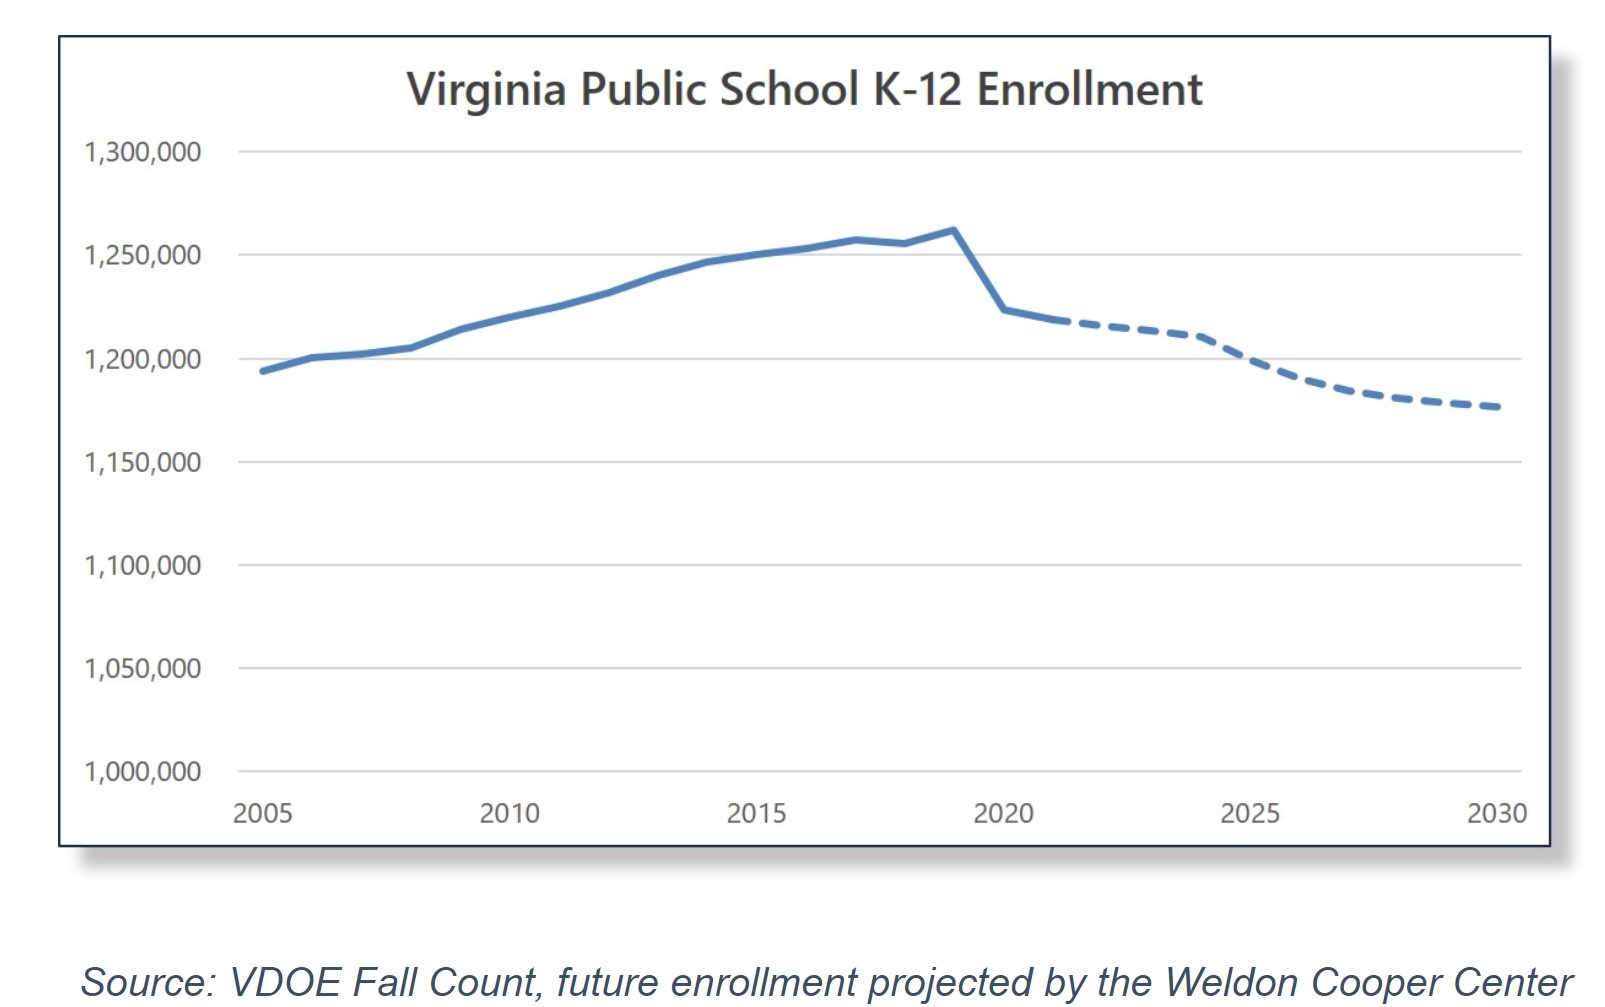
While the full magnitude of Virginia’s educational crisis has not been publicized — mainstream media have mostly ignored this data (even as Bacon’s Rebellion has been studiously tracking it) — many parents sense the changes and are “voting with their feet,” the report notes. The number of home-schooled students jumped from 38,000 in the 2019-20 school year to 60,000 during the COVID-fueled year of 2020-21.

The Virginia Department of Education will compile the performance data and share it with local school officials, teachers, parents and students. The Youngkin administration, said Guidera, is committed to making Virginia’s public education system “the most transparent and accountable in the nation.” Only in that way can Virginia hope to reverse the slide.


Share this article


ADVERTISEMENT

(comments below)


ADVERTISEMENT

(comments below)


Comments

36 responses to “The Hard Truth about Virginia Schools”

  1. LarrytheG Avatar
    LarrytheG

    there are differing perspectives about Virginia school performance and JAB often seems to present a “half-glass” picture that portrays Virginia in a worse light than the reality.

    The “cut’ scores for SOLs are the lowest in the nation – but they are not the test scores. It’s more of an anomaly than anything of real substance IMHO.

    Second, when looking at NAEP , be aware that they are testing BOTH private and public schools.

    Finally, JAB presents his view and to keep things balanced and objective, consider the things below also :

    https://uploads.disquscdn.com/images/8e3f86db9520ae7fccdd10f3f6944af1a546470ee02b5a54f8ba7fafeca0273d.jpg

    https://uploads.disquscdn.com/images/8fffd8bf1d97d9a06be176ab9e7c4e4fc435f15b1cfe9b21a38ff5709f8e6356.jpg

    https://uploads.disquscdn.com/images/8032046ecffd206431679b2e995b5b258d8fc359d382d3e9585b197bd26a1e0e.jpg

    Virginia does need to up it’s game – I agree – but when we have criticism without what we need to do – it comes across as more of a blame game than anything of serious substance – again IMHO.

    1. James C. Sherlock Avatar
      James C. Sherlock

      “The “cut’ scores for SOLs are the lowest in the nation – but they are not the test scores”.

      Yes, in fact, they are Larry.

      The BoE sets minimum cut scores for the achievement levels of fail/basic, pass/proficient, and pass/advanced

      Cut scores are based on the raw test scores (i.e. 35 of 40 for pass advanced in Grade 3 reading – an actual example) that are then converted to scaled scores (at least 500 for pass/advanced for the grades 3-8 reading tests (- same example).

      The reason that he raw scores are scaled is because the tests for different grades are judged by panels of school teacher judges to be of different degrees of difficulty. Grade 6 reading SOL currently requires at least 36 out of 40 for pass/advanced.

      So both 35 out of 40 (3rd grade) and 36 out of 40 (6th grade) are scaled to equal the same scaled score of 500.

      When the cut score is described as “lowered”, it means that the BoE has lowered the number of questions answered correctly for one or more grades for one or more scaled score for one or more test.

      That was done by the BoE in 2020 to achieve a political objective – fewer failures. The BoE would reply that it was an equity objective.

      Pick one. Same outcome.

      1. LarrytheG Avatar
        LarrytheG

        Let’s try this a different way.

        The SOL cut scores are the minimum passing scores. yes.

        But they do not conform to the NAEP cut scores where Virginia scores in the top 10 nationally.

        Or how would you explain this?

        I agree I botched it.

        To put this another way, if we have the lowest cut scores nationally, how can we rank in the top 10 nationally also?

        1. James C. Sherlock Avatar
          James C. Sherlock

          SOL cut scores are as I described them. The assessment that Jim presented was one of state standardized tests. That assessment indicates our students can miss more questions and still pass that students in any other state. Is that a perfect gauge, no. Different states can have tests with more or less difficult questions. But we have to assume that before publishing that comparison some attempt was made to account for those differences

          NAEP cut scores are based on an entirely different test. It is the American gold standard because it eliminates state differences in test design. I assume you are offering that we rank in the top ten in NAEP scores.

          If so, that is good, but as you wrote, we rank 25th as a nation, so it is like being the most valuable player on your Little League team. A nice artifact, but hardly indicative of success in higher levels of competition

          1. LarrytheG Avatar
            LarrytheG

            We agree on NAEP and it allows , I think, a more accurate picture of how Virginia is doing relative to a benchmark for all states.

            Beyond that, to be fair and honest, we need to acknowledge how long a period – all of the states scores have not really advanced significantly , not just Virginia.

            https://uploads.disquscdn.com/images/8bf9091c6f1706b1e88a3d4a4ecd653e80415ddc20178751e1f10428f9eb4a82.jpg

            https://nces.ed.gov/fastfacts/display.asp?id=38

            If Virginia is going to truly address this, it will have to be a transformative change – in the way – that we teach AND in the way we grade “proficiency”.

            I’m hopeful that what Youngkin is doing is not engaging in PR to trumpet his anti-equity, anti-CRT stuff.

            And once again, I support taxpayer-funded Charter schools that specifically target the disadvantaged kids AND are transparent about their testing so that we KNOW they are effective, not only the kids in Richmond, the kids in Henrico also.

          2. James C. Sherlock Avatar
            James C. Sherlock

            In response to your question about the Achieve Foundation’s Honesty Gap, see https://honestygap.org/fact-sheet/. The Achieve foundation in 2020 shut down and passed the torch to three separate foundations created by its founders. https://www.achieve.org/files/Statement%20from%20Michael%20Cohen_FINAL.pdf

  2. James Wyatt Whitehead Avatar
    James Wyatt Whitehead

    I knew about the gap but I did not know this new term. Honesty gap is real. Unfortunately the best standardized testing will ever do is put students in the ball park when measured. It will never fully reveal what students do and do not know.

    1. LarrytheG Avatar
      LarrytheG

      New to me also but Achieve is apparently a national organization formed in 1996 and apparently supports Common Core.

      Perhaps JAB intends to do a post on Achieve , who they are, their history and efforts.

      This “gap” and it is one, seems to be statewide in Virginia across all school districts large and small… in-person instruction or remote, etc.

      And they produce this Honesty Gap for many or all states.

      1. I think Achieve developed Common Core, which the Feds then paid the States to adopt.

        1. LarrytheG Avatar
          LarrytheG

          well.. the would pay money for them to use to adopt and once the conservative backlash to common core got into gear, most states opted out. Right?

    1. James Wyatt Whitehead Avatar
      James Wyatt Whitehead

      You make some great points about NAEP. I came across the 1895 Final Exam for the 8th grade in the comments section. There is no way today’s 8th graders could pass it.
      https://www.grc.nasa.gov/WWW/K-12/p_test/1895_Eightgr_test.htm

      1. Most of that stuff is no longer taught, with good reason.

        1. James Wyatt Whitehead Avatar
          James Wyatt Whitehead

          Now I know why most of my old school relatives dropped out in the 8th grade.

  3. James C. Sherlock Avatar
    James C. Sherlock

    The apologists for the declining standards and performance of Virginia public schools have their heads firmly and deeply buried in the sand.

    Some of the regular ankle-biters among our commenters do not want to hear facts, so none will convince them. Ever.

    They object now to the current government saying out loud what the previous two administrations knew but refused to publicly acknowledge out of some fatally flawed concept of “equity”. By that “equity” they meant: tell no truth that offends; maintain no standard that exposes failure of the schools to teach.

    The fact that those policies disproportionately disadvantaged poor minorities was not as important as the “narrative”. The profound and life altering cruelty of that philosophy is overwhelming.

    Fortunately we have elected a governor and he has appointed high quality, dedicated people to take on the task of improving the schools.

    I hope (but will never assume) that the usual critics on here do not disapprove of improving the schools.

    But maybe they will.

    1. LarrytheG Avatar
      LarrytheG

      perceived ankle-biter or not – I support more rigor and Common Core (unlike more than a few Conservatives).

      I don’t think “equity” had anything at all to do with what JAB is talking about which has been that way for some time.

      The last NAEP testing was 2019 if not mistaken and the next one is 2022.

      The reality is that Virginia, as bad as some naysayers continue to blather, that Virginia ranks in the top 10 in the Nation.

      Does it need to get better? Yes… in no small part because even though we rank in the top 10, we rank 25th compared to other countries.

      We’ve got the “PR” part of Youngkin’s “education’ thinking but let’s get some BEEF. Where is it?

      We know what happens if we make the SOLs harder – more kids fail them.

      So, I’m all ears as to how – across Virginia from Fairfax to Henrico to Matt Hurts Region VII – how we will teach “better” than we do now.

      I’m all for it. Let’s see more of that and less blather.

      1. Speaking of Matt Hurt, the Youngkin administration thinks he is awesome. He has had a significant impact on the thinking of the newcomers to the Virginia educational system like Jillian Balow. I expect we’ll see his data-driven approach employed more widely.

        1. LarrytheG Avatar
          LarrytheG

          What I perceive Region VII to be doing is a bit of a more formal approach to mentoring teachers – newbies and others who benefit from the habits of more experienced, effective teachers and I think would be good for other schools that have numbers of economically disadvantaged kids.

          I look at the lower performing schools in places like Henrico and wonder how the same top-level administration presides over both some very very good schools at the same time, in the same district, under the same leadership, some very low performing schools that more or less align with lower-income neighborhood demographics (not unlike Richmond).

          It’s the SOL/NAEP scores from these low performing schools that actually drag Virginia down from being even higher than top 10 nationally.

          If these kids were not counted, Virginia, quite likely would score higher, perhaps in the top 5.

          But to get from 25th in the world to top 10 in the world, would be such a magnitude that it’s not likely at all that Youngkin will get that to happen.

          We’ll see. So far, we’re heavy on PR and lite on the actual academic changes he might have in mind.

  4. LarrytheG Avatar
    LarrytheG

    https://uploads.disquscdn.com/images/c7c6e565e183123c326c82bf5179a9ecd85e3a564dca89bf913db24e21122d9a.jpg NAEP is not without it’s critics and detractors but some of it is misunderstanding what the scores are and are not :

    Here’s a Brookings article:

    https://www.brookings.edu/blog/brown-center-chalkboard/2016/06/13/the-naep-proficiency-myth/

  5. My conjecture is that proficiency in NAEP is just a distribution cut, which is why it is about a third. Hence it is meaningless. SOL tests on the other hand are measuring what is supposed to be taught. NAEP on the other hand appears to be “measuring” a vague combination of intelligence and prior knowledge, probably mostly the latter. Since the specific test data is not available there is no way to tell.

    1. James Wyatt Whitehead Avatar
      James Wyatt Whitehead

      A distribution cut is expedited and easy but ends up being useless. No pinpointing to arrive at a meaningful cut score.

  6. James Wyatt Whitehead Avatar
    James Wyatt Whitehead

    Youngkin and Ballow should factor this into their education reforms: declining enrollment. Now if a school district resides near the Virginia urban/suburban crescent enrollment should remain steady or growing. Outside the crescent, long term declining enrollment. Rural school districts are going to need help. Declining enrollment means declining dollars for schools.
    https://statchatva.org/2022/01/26/school-enrollment-in-a-post-pandemic-virginia/
    https://uploads.disquscdn.com/images/74904da770ea01bebc30c6dc79bbefa55d5cba24fca9682e9170d0214217f41b.jpg

    1. CJBova Avatar

      Declining enrollment should mean reduced administrative staffing too. Haven’t seen that happening.

    2. LarrytheG Avatar
      LarrytheG

      That’s a good point but most rural schools are primarily set up for basic SOLs which the SOQs usually pay for.

      But if Youngkin wants to increase the SOL cut scores, it’s likely to take more SOQ money for more teachers and higher qualified teachers AND it likely will require a
      larger local match … unless the state is going to pick up all the cost.

      There’s going to be a budget impact if changes like this
      are in the realm of Youngkins plans.

      1. James Wyatt Whitehead Avatar
        James Wyatt Whitehead

        Youngkin claims that he wants to invest in public education. Yes, the state (Northern Virginia that is) should pick up the change for higher standards.

  7. CJBova Avatar

    Larry, You said., “But to get from 25th in the world to top 10 in the world, would be such a magnitude that it’s not likely at all that Youngkin will get that to happen. ..We’ll see. So far, we’re heavy on PR and lite on the actual academic changes he might have in mind.”

    The ranking is meaningless if our children can’t acquire the basic skills to get through life. The Governor did his part and started the process by putting Jillian Balow in as Virginia Superintendent of Public Instruction. Her report is her assessment of where we are. From there, she and her people will decide how to approach the problem. How about giving them some time to act before you assume it won’t happen?

    1. LarrytheG Avatar
      LarrytheG

      Carol – so somewhere higher than the SOLs but lower or different from NAEP/PISA are those subjects that kids are not getting to get them through life?

      I’m supportive but skeptical but willing to give it some time but they should be willing to lay out an approach to how they want to proceed also.

      JAB points to NAEP , right? Is that also too high a target?

      It’s this kind of thing I would expect to hear from Youngkin and Balow – where do they want to head?

      NAEP, PISA, more than the SOLs, Common Core? what?

      is that too much to expect?

  8. Eric the half a troll Avatar
    Eric the half a troll

    This chart shows two things… first an upward trend over time and that Celsius or Fahrenheit, scale matters not… https://uploads.disquscdn.com/images/71055d8c0f8646d7b700f52182a7237f9185d7dd13b9256b2eed6a017c17c649.jpg

    1. Nancy Naive Avatar
      Nancy Naive

      If we wouldn’t chintz of schools we’d get better results. You get what you pay for.

    2. James C. Sherlock Avatar
      James C. Sherlock

      If that makes you feel better, go with it. Please note that Virginia has drifted back towards the national average, which itself is a disgrace. Which is the point.

      Like getting an award for being the fifth most valuable player on a team stuck in the second division of the league.

      1. Eric the half a troll Avatar
        Eric the half a troll

        My point is that since they are different scales, you can’t really compare between them. We are definitely in an upward trend which is important. The % proficiency is pretty meaningless as an absolute number if we don’t really understand what that means (on either scale) … perhaps you do…

  9. Dick Hall-Sizemore Avatar
    Dick Hall-Sizemore

    It is clear that Virginia scores on various standardized tests have declined, both absolutely and in relation to national averages.

    That being said, it is not that the prior administration was not aware of the declines. Superintendent James Lane expressed alarm over the declining reading scores and declared a determination to examine what some districts were doing and see how much could be replicated in districts where students were not doing as well. Then the pandemic hit.

    It is good that the current administration is highlighting the challenges. However, it has an “honesty gap” of its own. In comparing the SOL “proficiency” rates with the NAEP “proficiency” rates, the administration is implying that the two tests measure the same thing. They do not.

    The organization that administers the NAEP makes that quite clear:

    “NAEP Proficient is defined differently than other uses of the term. For example, the Every Student Succeeds Act refers to student “proficiency.” State assessment systems may use the terms “proficient” and “proficiency,” but there is wide variation in how states define proficient, e.g., equivalent to grade-level performance or a description of what students already know. This variation in terminology is often a source

    of confusion when it comes to understanding the NAEP achievement levels. NAEP Proficient represents solid academic performance for each grade assessed. Students reaching this level have demonstrated competency over challenging subject matter, including

    subject-matter knowledge, application of such knowledge to real-

    world situations, and analytical skills appropriate to the subject matter. Thus, NAEP Proficient represents the goal for what all students should know.”

    In short, “It should be noted that the NAEP Proficient achievement level does not represent grade level proficiency as determined by other assessment standards (e.g., state or district assessments).”

    https://www.nagb.gov/content/dam/nagb/en/documents/naep/achievement-level-one-pager-4.6.pdf

    On the other hand, the SOL proficiency level sets out what a student should be able to do at that level. See SOL Grade 4 Readling Level Descriptor: https://www.doe.virginia.gov/testing/scoring/performance_level_descriptors/index.shtml

    As other commenters have pointed out, comparing the NAEP and SOL proficiency rates is like comparing apples and grapefruits. They test different things, they measure it differently, and, according to one practitioner, the NAEP proficiency and above standards are much beyond what is normally taught at a specified level.

    The Youngkin administration would have more credibility if it spent more time telling Virginians clearly what is wrong and less time trying to trash the prior administration with meaningless comparisons.

    By the way, as for the cut scores, comparing cut scores among states has no meaning unless one has some idea of the comparative difficulty of the tests. For example, at W&M, on the standard scale, between 70 and 80 was a C. However, in Dr. Guy’s Chemistry 101-102 Chemistry class, the C range was 65-80. (Thank goodness!)

  10. Ruckweiler Avatar
    Ruckweiler

    Ah, yes, equity. Equity of dismal outcomes, unfortunately. Yet another leftist bad idea.

  11. energyNOW_Fan Avatar
    energyNOW_Fan

    If I look at Fairfax County, I would say demographics have probably changed , with more diversity and immigration in. So part of the difference could be a different student body. At the start of the COVID pandemic, our Board Supervisor said 45% of FfxCo families do not speak English at home, and I have to assume that % has been trending upwards last 20 years.

Leave a Reply