Surveying the Damage in K-12 Schools

by James A. Bacon

Last month the National Assessment of Educational Progress (NAEP)  released its Nation’s Report Card, which showed that the average math test scores declined by eight points nationally. It was difficult for most Americans to know what to make of the loss. The scores were an abstraction. How bad was the loss of five points?

The Education Recovery Score Board, a collaboration between Harvard University and Stanford University, has devised an answer. Drawing upon the NAEP scores and standardized test scores from 29 states, the Harvard-Stanford team translated the drop in NAEP scores into years of education lost. The average U.S. public school student fell behind a half year in math, and a quarter year in English.

The Education Recovery Score Board performed another valuable service. Where the NAEP published state-average scores, the Harvard-Stanford project mapped the NAEP scores to the school-district level, providing greater granularity in the data and exposing wide differences between school districts within states.

“The pandemic was like a band of tornadoes that swept across the country,” said project co-director Thomas J. Kane. “Some communities were left relatively untouched, while neighboring schools were devastated.”

Judging by NAEP’s state-level data, Virginia got hit by more than its share of tornadoes. The decline in math scores between 2019 and 2022 was the worst in the nation, and in English almost as bad. But the Education Recovery Score Board data show enormous variability within the state. Some school districts survived with modest damage; others were flattened.

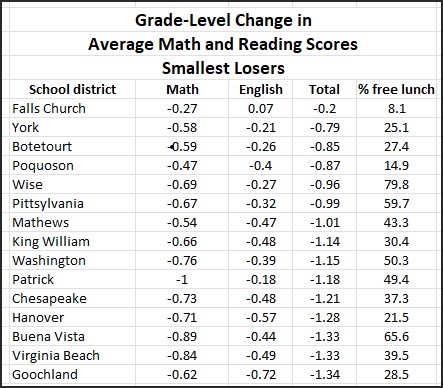
The cities of Falls Church and Poquoson and the counties of York, Botetourt and Wise survived the COVID pandemic in comparatively good shape, losing in the realm of a half year in math on average and two-tenths of a year in English — roughly in line with national averages. Falls Church actually saw a tiny gain in English scores — the only locality in Virginia to do so.

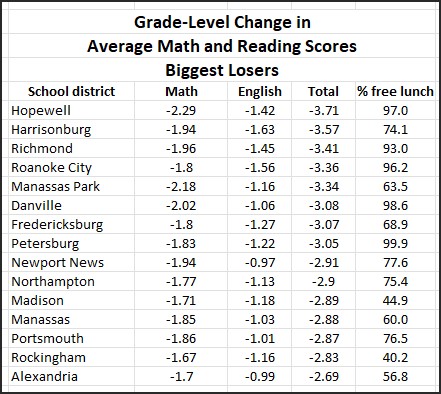
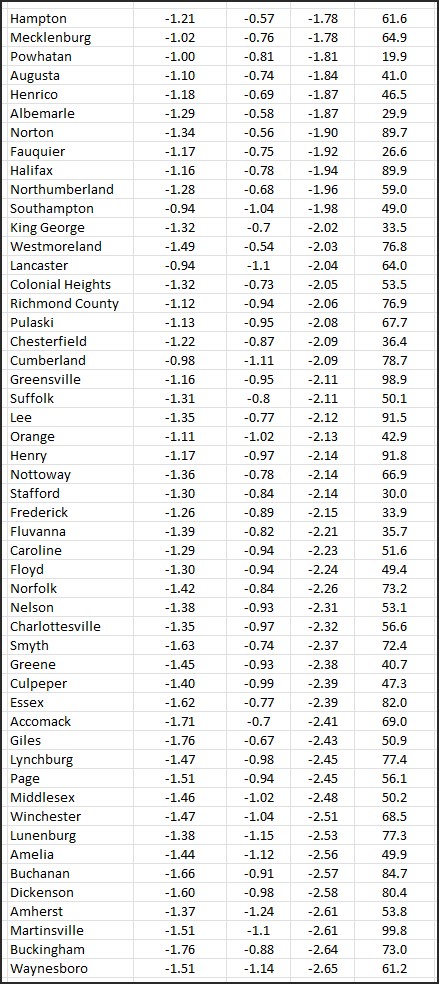
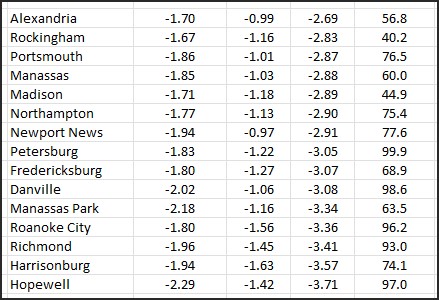
Conversely, the three years between 2019 and 2022 were catastrophic for the older, predominantly minority urban centers of Hopewell, Harrisonburg, Richmond, the City of Roanoke, Manassas Park and Danville. Those school districts lost roughly two years of ground in math and nearly a year-and-a-half in English.

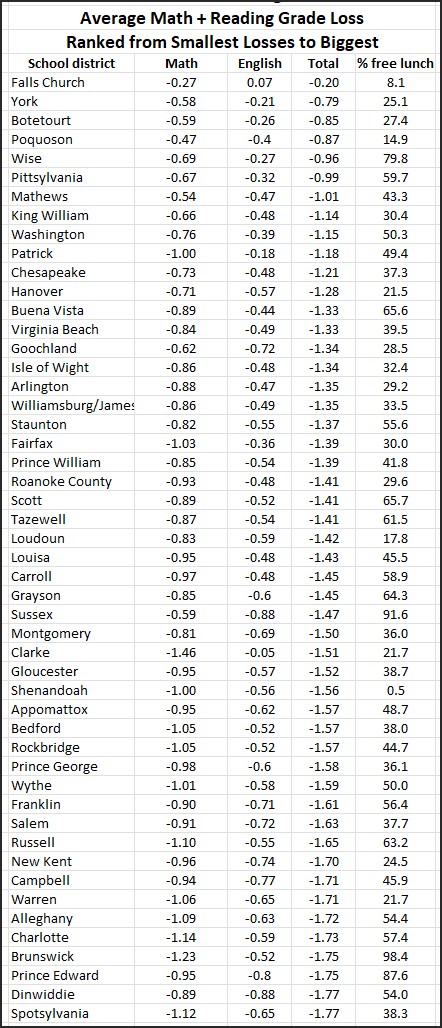
(Score summaries for all Virginia localities appear at the bottom of this post.)

An interesting finding from the Harvard-Stanford exercise is the wide variability between school districts with similar socioeconomic profiles. Overall, school districts serving economically disadvantaged student populations (qualifying for subsidized lunch programs) fared worse during the pandemic and its aftermath than districts serving non-disadvantaged students.

That disparity comes as no surprise to anyone, as it has been replicated by state Standards of Learning (SOL) pass rates, early childhood literacy assessments, and other tests. Likewise, there is abundant anecdotal evidence to suggest that students from poorer neighborhoods had issues not only with Internet access but also with family situations — single-parent households in which that parent had to work — that resulted in desultory participation in online learning.

The trend line in the scatter graph below shows the significant correlation between “economic disadvantage” of district student populations (vertical axis) and the number of years of grade loss (horizontal axis).

This graph shows shows the relationship between “Economic disadvantage” (defined by participation in subsidized school lunch programs) and the combined number of grades lost for math and reading.

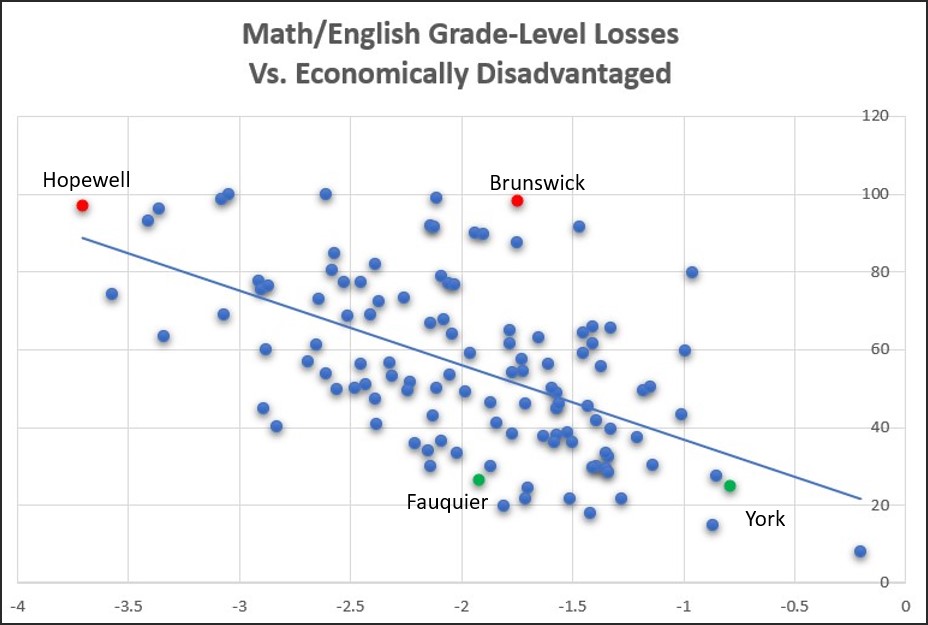
Clearly, socioeconomic status is an important variable. Just as clearly, however, that factor accounts for only about a third of the variability. One might surmise that policies and practices of local school districts were equally important, if not more so.

For example, compare the two red dots on the graph: one representing Hopewell, a small city in the larger Richmond metropolitan region, and one representing Brunswick County in rural Southside Virginia. Both had very high percentages of lower-income students: Hopewell 97% and Brunswick 98.4%. But Hopewell experienced a total of 3.7 years of learning loss (2.3 years for math and 1.4 for reading) compared to only 1.7 total years of learning loss (1.2 in math and 0.5 in reading) for Brunswick.

It might be instructive to compare the respective approaches to education in Hopewell and Brunswick.

As another example, compare the green dots: Fauquier County and York County. Both are relatively affluent localities, with only 27% economically disadvantaged students in Fauquier and 25% in York. But Fauquier students lost 1.9 years combined in math and English; York lost only 0.8 years. Again, it might be worthwhile to compare and contrast philosophies and policies.

Bacon’s bottom line: The Harvard-Stanford project does nothing to contradict the Youngkin administration’s conclusion that catastrophic learning loss has occurred in Virginia. But it makes clear that the backsliding was far worse in some districts than others. School boards should take a look at their district’s relative standing to diagnose what went wrong, fix mistakes and share best practices for setting things right.


Share this article


ADVERTISEMENT

(comments below)


ADVERTISEMENT

(comments below)


Comments

19 responses to “Surveying the Damage in K-12 Schools”

  1. Dick Hall-Sizemore Avatar
    Dick Hall-Sizemore

    As I understand the NAEP process, the tests are given to a representative sample of schools in a state. So, not every school in a district would be participating. Therefore, I don’t understand how the Harvard-Stanford process could “map” the scores to a school district level if not every school in that district participated in the test, unless the assumption was that the participating school was representative of the district as a whole, which may not always be the case. Some of the education experts on this blog could undoubtedly address this better than I can.

    1. Nancy Naive Avatar
      Nancy Naive

      “Some of the education experts on this blog could undoubtedly address this better than I can.”

      Not likely, unless they are experts in sampling and statistics too.

    2. LarrytheG Avatar

      Yes. Not all kids are tested. Not all schools. Not even all the 4th and 8th grade classes where a school is a tested NAEP school.

      And from what I’ve been told, not even all the kids in a 4th grade or 8th grade class.

      It’s a heavy duty exercise in data sampling.

      https://nces.ed.gov/nationsreportcard/pdf/about/2009493.pdf

      Depending on whether or not one would trust the govt doing data (and more than a few these days do not), it is considered valid for the purposes for which it is designed but only for those purposes and not necessarily valid for other purposes.

      So a lot depends on the methodology of folks outside of NAEP using NAEP data in concert with State data like SOLs. I’d like to see NAEP say they’re ok with it.

      In this case, they almost surely do NOT have a school by school, class by class data to correlate with SOLs so you have to trust both the NAEP data and the folks who correlated it with SOL data.

      I do trust both NAEP as well as SOL data and probably trust this data but folks ought to realize what it is not.

      I think they did this for several states.

      But at the end of the day, what is done is done and the task at hand is not to continue to blather about the pandemic and shut downs, it’s how to go forward.

      Right now, today, in schools that are in session – I don’t see a state-led plan.

      1. Kathleen Smith Avatar
        Kathleen Smith

        1800 in 4th Grade Math
        1800 in 8th Grade Math
        1600 in 4th grade Reading
        1800 in 8th Grade Reading

  2. Nancy Naive Avatar
    Nancy Naive

    The fact that Trump was the GOP nominee in 2016 shows the damage was done some 60 years ago. That he won the Electoral College shows the real damage was baked in in 1781.

  3. Nancy Naive Avatar
    Nancy Naive

    The fact that Trump was the GOP nominee in 2016 shows the damage was done some 60 years ago. That he won the Electoral College shows the real damage was baked in in 1781.

  4. Kathleen Smith Avatar
    Kathleen Smith

    The data is interesting. The numbers look right. I have looked at some data from some schools in Dr. Hurt’s consortium, where schools actually made gains. Bottom line for me as an educator: I think the loss lies not in the number but more in the content. K-3 students lost content in Reading while 4-7 students lost more content in mathematics. These are formative years. Here is my data –

    https://www.dropbox.com/s/a7pao4qkrcbedxn/3The%20Expected%20Learning%20Loss.docx?dl=0

    1. LarrytheG Avatar

      That’s pretty impressive . Gonna have to take some time to go through it.

      thanks for posting it!

    2. Lefty665 Avatar

      The good news may be that Youngkin’s initiative to work with K-3 kids to get all kids reading up to grade level by third grade is targeting the right group for several reasons.

      1. Kathleen Smith Avatar
        Kathleen Smith

        I agree

  5. James C. Sherlock Avatar
    James C. Sherlock

    The highest losses from the worst starting points and vice versa. We did not need the NAEP to tell us that. We must call incompetence what it is. We have schools that are really good at teaching poor and minority kids. But we have far too many that are not.

    I call for far fewer state laws and regulations of how schools are run, not more. Many of them have nothing to do with student learning. Judge schools on academic results, not compliance with regulations that are at best unlikely to be optimized for any individual school.

    Pay principals more to run and teachers and special staff more to work in the most challenging schools. Hold them accountable for both good and bad student outcomes measured relative to prior years.

    Until we get a constitutional amendment in Virginia to enable the state to take over and run failing schools divisions and to implement by law some of the wide array of parental choice options demonstrated in Wisconsin, these articles will continue to write themselves.

    The fact that teachers unions and the organized left oppose all of that tells you everything you need to know. They don’t care whether poor kids learn or not. And no, it is not about more money. Kids will never learn in school divisions which don’t have child learning as their organizing and dominant principle, and too many do not.

    Virginia’s leading ed schools’ contribution to policy, over which they had absolute control for eight years, has mostly had negative effects on learning. I will wait while they confer and tell us one thing they recommended that has had a positive effect on outcomes.

    RPS, as an example of a failed school division, is run for the adults in the system. The school board does not even bother to pretend otherwise. No amount of money will fix that. It needs to be taken over 100% by the state and the school board dismissed along with any employees who are not going to be part of the solution.

    With the constitutional amendment in place, I would recommend the state bring in a couple of the most high performing charter management organizations to build and operate networks of urban public schools under state charters as fast as they could efficiently and effectively do it.

    Alternatively, save this article and just reprint it every couple of years.

    1. Kathleen Smith Avatar
      Kathleen Smith

      Let’s not forget Petersburg. 0 out of 22 years. Two generations.

      1. James C. Sherlock Avatar
        James C. Sherlock

        You are of course correct. But Richmond makes me madder. Far more resources than Petersburg, but there seems no amount of money that would change a thing.

  6. Eric the half a troll Avatar
    Eric the half a troll

    “The trend line in the scatter graph below shows the significant correlation between “economic disadvantage” of district student populations (vertical axis) and the number of years of grade loss (horizontal axis).”

    What is the r^2? Looking at that graph, I’ll bet it is less than 50% and would not be a significant correlation.

    1. Dick Hall-Sizemore Avatar
      Dick Hall-Sizemore

      Good question.

    2. Kathleen Smith Avatar
      Kathleen Smith

      Pearson Correlation
      .556 for the Total loss
      .518 for Math
      .511 for Reading

      1. Eric the half a troll Avatar
        Eric the half a troll

        That is iffy, imo. Certainly not significant… again, imo.

    3. Nancy Naive Avatar
      Nancy Naive

      #6 bird at 50 feet aka a Cheney lawyer pattern.

      The nice thing about a scatter plot like that one is being able to close one eye and squint with the other, and seeing… a hat, a broach, a pterodactyl…

      1. Lefty665 Avatar

        … a Repub lawyer.

Leave a Reply