School Districts’ COVID Recovery Varied Widely

The “rebound” percentage expresses the 2021-22 English SOL pass rates to the pre-pandemic 2018-19 pass rates.

by James A. Bacon

Statewide student performance in the Standards of Learning (SOL) exams regained some ground lost earlier in the COVID-19 pandemic, according to recently published Virginia Department of Education (VDOE) data. But not all school districts were equally resilient.

In 2018-19, the year before the disruptive pandemic, 77.6% of Virginia public school students passed their English SOL exams. The state did not administer the exams the next year when all schools shut down in the spring in response to the COVID panic. Then in the second academic year of the plague, when many schools had turned to remote and hybrid learning, the pass rate fell to 69.3%. This past year in which in-person learning resumed, 2021-22, the statewide pass rate rebounded partially to 73.1%.

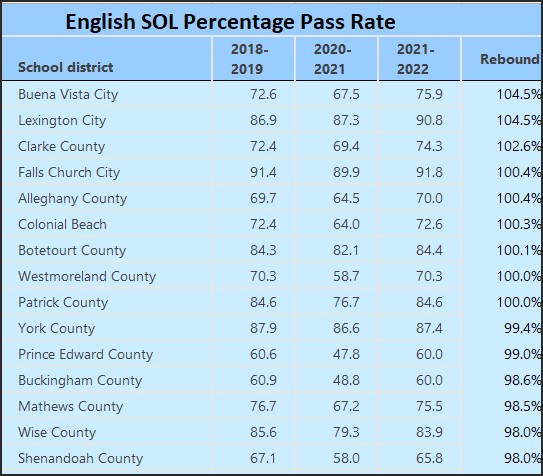
The state averages conceal considerable variability, however. In crunching the latest VDOE numbers, Bacon’s Rebellion has identified seven school districts where the pass rate exceeds pre-pandemic performance, and seven others where the pass rate remains 20% less than it was three years ago.

In the small Shenandoah Valley cities of Lexington and Buena Vista, the English SOL pass rates are 4.5% higher than before. But in the small cities in eastern Virginia, Hopewell and Franklin, the pass rate has barely budged since the previous year, stuck at 77.1% and 72.3% respectively.

Why the disparity in outcomes?

VDOE officials provided an important clue when releasing the new data last week. According to the Youngkin administration, students who engaged in in-person learning in 2020-21 scored better the following year than those who did not. Stated the press release:

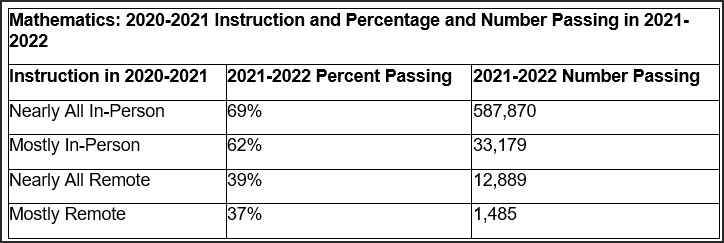
A Virginia Department of Education analysis of statewide data shows a strong correlation between in-person instruction during 2020-2021 and higher achievement on the 2021-2022 SOLs. For example, 69% of students who experienced in-person instruction for nearly all of 2020-2021, and 62% of students who experienced in-person instruction for most of 2020-2021 passed their 2021-2022 math tests, compared with 39% and 37% who experienced nearly all or mostly remote instruction, respectively.

Source: Virginia Department of Education. Note: Total public school enrollment in 2021-22 was 1,251,970.

Although the pass rates for reading were higher in English reading than math, the disparity between mostly in-person and mostly remote was comparable.

That is powerful data, if it fully represents reality.

I have reservations about the data, however. It suggests that the overwhelming majority of Virginia students experienced “nearly all” in-person learning, while those engaging in “mostly remote” learning were a tiny minority. That doesn’t jive with almost everything we know about which school systems shifted to remote and which kept classrooms open. For example, here is a map showing the in-person/remote status of Virginia’s 132 school districts in August 2020.

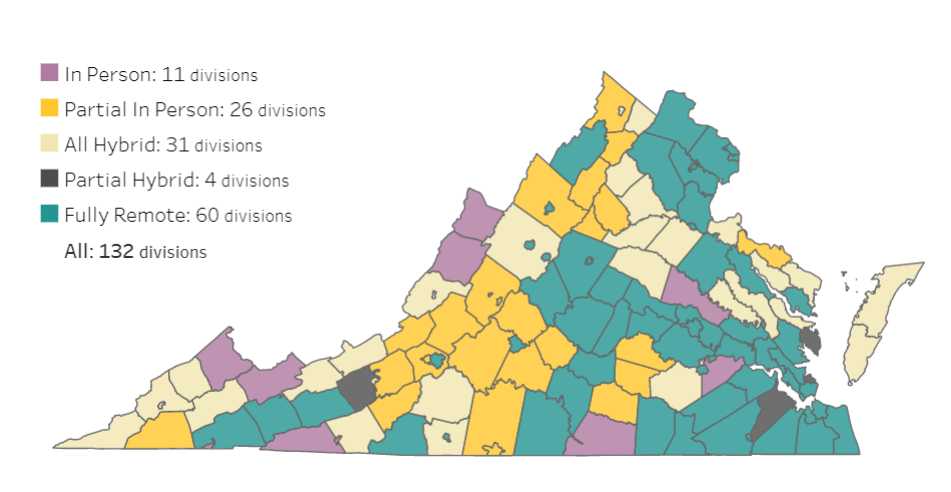
Not only did 60 divisions embark upon the school year in fully remote mode, those districts — Fairfax, Loudoun, Prince William, Virginia Beach, Chesapeake, Henrico, Chesterfield — had by far the most students. Some districts changed their mode of instruction as the year wore on, but a large majority of students undeniably started out their school year with remote learning.

For its analysis, Team Youngkin used a different methodology than those who prepared this map in 2020. According to VDOE spokesman Charles Pyle, the administration drew from the annual End-of-Year Student Record Collection, which contains a data item called “Remote Learning Percent of Time.” The analysis then divided students into the four buckets shown in the table above based on the percentage of time spent in remote learning. To reduce the possibility that mobility between districts affected the pass rates, the table includes only students enrolled in the same school for 80% or more of the year. Pyle concedes that there was some “noise” in the numbers resulting from some school districts providing estimates and some submitting precise percentages, but it’s hard to imagine that significantly impacting the overall findings. 

The approach sounds reasonable. But it just doesn’t square with what everyone knows to be true: to wit, that most Virginia K-12 students were given remote or hybrid instruction in the 2020-21 school year. Indeed, Team Youngkin has argued much the same in comparing the high rate of remote learning for Virginia students compared to that for other states.

VDOE did not create district-level reports, so even if you are comfortable with its methodology, the statewide report gives us no insight into the resilience displayed by different school districts. A different approach is needed.

In the tables below, I listed the English SOL pass rate for each district in the pre-pandemic year of 2018-19 (pre-pandemic), 2020-21 (height of the pandemic when remote learning peaked), and 2021-22 (when in-person learning resumed). Next, I calculated the pass rate of the most recent year (2020-21) as a percentage of the pre-pandemic year (2018-19) to determine the degree to which SOL scores have recovered from the school shutdowns. Then I ranked the districts in the order of the rebound. Those at the top — Buena Vista and Lexington — exhibited the strongest recovery. Those at the bottom — Hopewell and Franklin — showed the least.

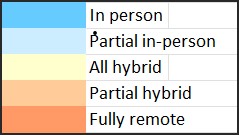
Finally, I categorized each district by the categories displayed in the 2020 map above. Here is the color key:

Resilience in SOL scores: top quartile
Resilience in SOL scores: 2nd quartile
Resilience in SOL: scores: 3rd quartile
Resilience in SOL scores: bottom quartile

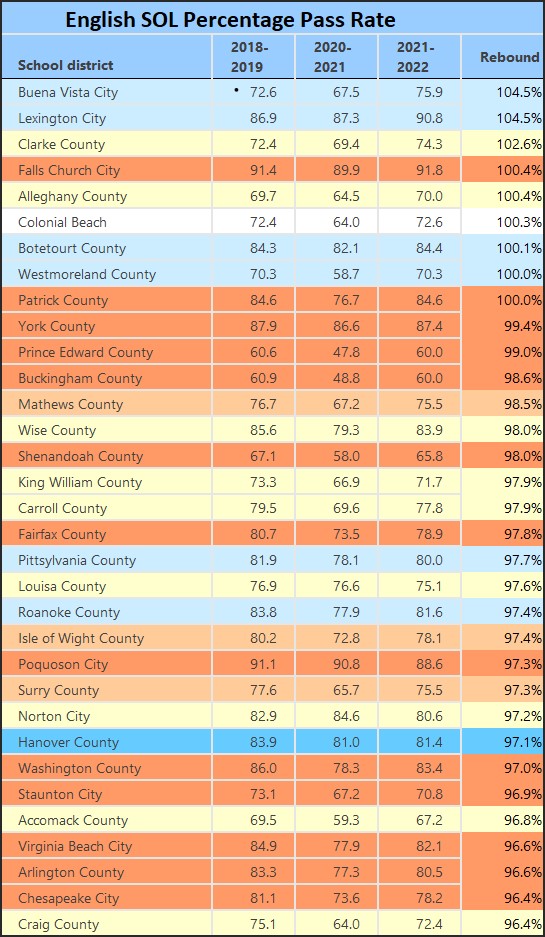
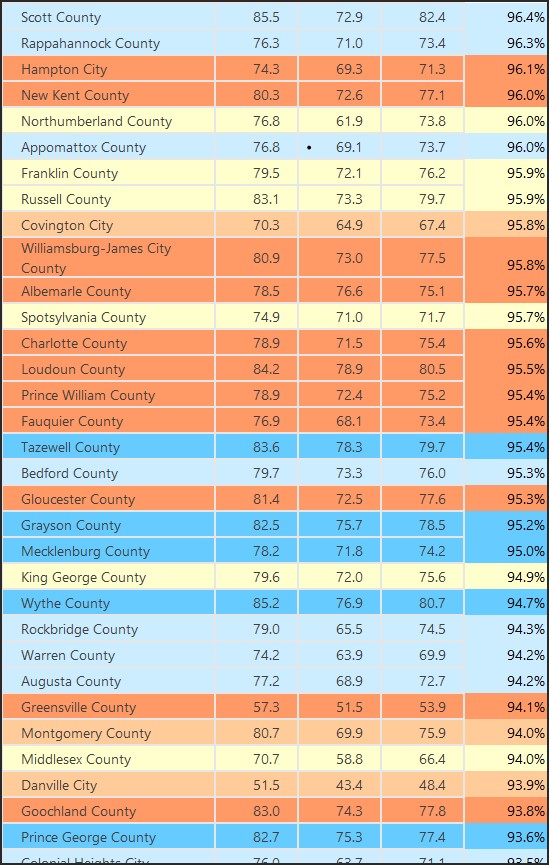
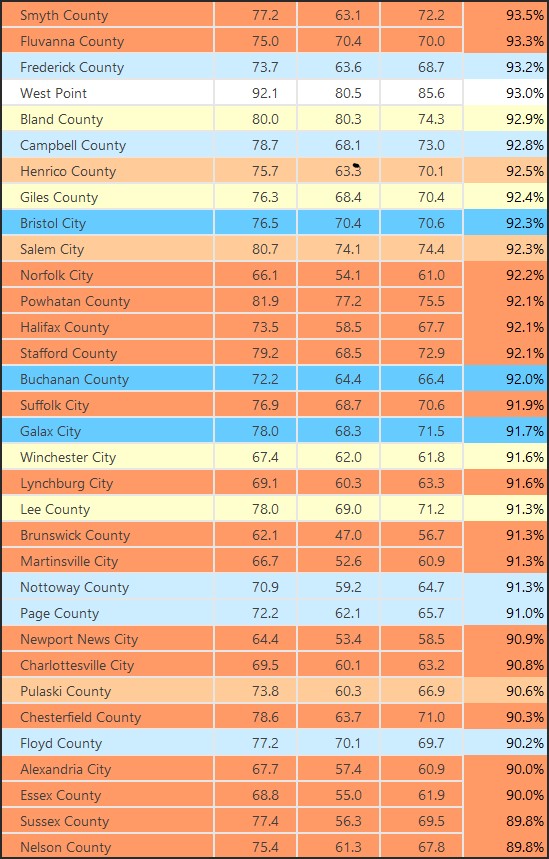
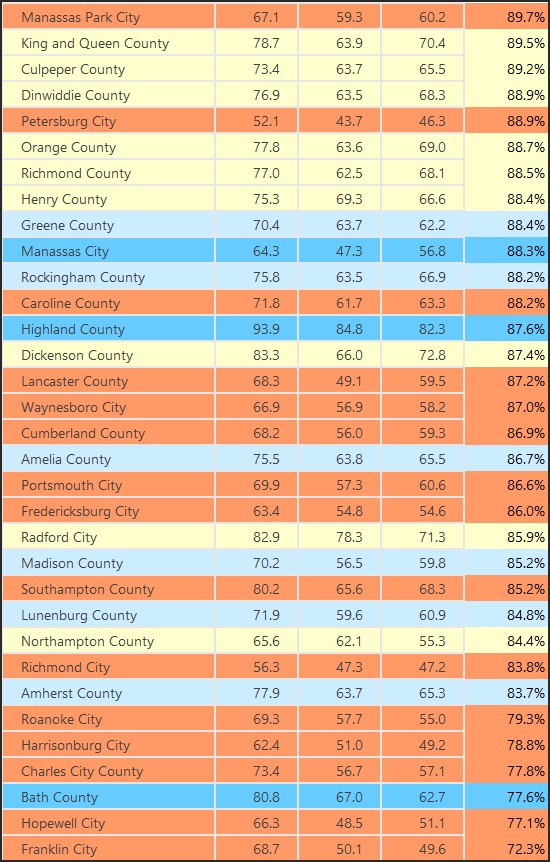
What becomes apparent from eye-balling these tables is that there is a mix at every SOL-rebound level. Some school districts that shut down in-person learning have recovered smartly. Likewise, some districts that maintained in-person learning saw significant drops in pass rates. Indeed, Bath County, traditionally one of Virginia’s strongest performers measured by SOL pass rates, lost ground in 2020-21 and then lost more ground in 2021-22.

I’m surprised by these findings. In line with what the Youngkin administration contends, I would have predicted that in-person learning in 2020-22 would have contributed to far better results the following year when students returned to school. A deeper analysis still may show that to be the case. Perhaps the difference can be attributed to the fact that the Youngkin analysis looked at math SOL scores, while I looked at English reading SOL scores, but I doubt it. Relative performance of the two are tightly correlated. I suspect that there is more to the story. Other factors are at play, and the interaction of those factors with a school district’s history of in-person/remote learning could tell us far more than remote-learning status alone.

I would have happily embraced Team Youngkin’s storyline because it comports with the narrative I have pushed on Bacon’s Rebellion. But reality is complex, darn it. I’m not suggesting that the narrative is wrong, just incomplete. There is something else going on, and we need to find out what it is.


Share this article


ADVERTISEMENT

(comments below)


ADVERTISEMENT

(comments below)


Comments

24 responses to “School Districts’ COVID Recovery Varied Widely”

  1. Virginia Gentleman Avatar
    Virginia Gentleman

    Thank you — a very fair and thoughtful post. Good read.

  2. DJRippert Avatar
    DJRippert

    What would be equally interesting to see would be the health consequences for students, teachers and school employees comparing schools which stayed open and schools which went all virtual. Did the severe adverse health consequences of in-person education come to pass (as some teachers, administrators and commenters on this blog predicted)?

  3. Kathleen Smith Avatar
    Kathleen Smith

    Comparing apples to oranges. I have been working on a similar data set. First, you are not comparing cohorts. So the students pre Covid were in one grade, say grade three, and in another, 6th grade, post Covid. In addition, the math pre and post (19 and 22) results are both using the new lowered cut score. However, the reading cut scores were higher in 19 than they were in 22.

    I am trying to understand, but frankly, the lowered cut scores in math and reading are downright scary. I am so hoping that the scores were not lowered to cover up a bigger achievement gap that what exists, but it doesn’t look good.

    Honesty gap?

    And we have no way of knowing what K students in 19-20 lost until next year. This was at the height of the pandemic. I can’t picture K students in a very bad rendition of on-line learning that took place throughout Virginia.

    1. Lefty665 Avatar

      I assumed the data was aggregate SOL passing rates for all the kids in the school system. That makes it 2018-2019 apples to 2020-2021 apples to 2021-2022 apples. What is wrong with that comparison?

      I surely agree that the change in the base, the cut scores, is problematic, and yes, scary. There is an old saying: “If all else fails, lower your standards”.

      1. Kathleen Smith Avatar
        Kathleen Smith

        The problem with non cohort data is that it does not answer how much learning loss for the same group of students. In other words, did the 3rd grade fair worse than 6th grade? Both are good ways to look at data. My hypothesis is that younger students had to recover more than older students due to maturity. Did students in some grades fair better than other grades during the pandemic. Just another slice of the data.

        One more note, as a teacher, I had really good classes on year, and the next, the kids needed a lot more review before mastery.

        1. Lefty665 Avatar

          Thanks, makes sense. Certainly with the younger kids, a year of school is a larger percentage of their school time too.

          Amazing how that changes isn’t it? You’d think that kids are kids year in and year out, but they vary. I hired out of VCU graduating classes for a decade or so. It was strange, some years there would be lots of good candidates, others not so much. We used to rag the profs about sleeping on the job some years. They’d beg off it was differences in the kids, we’d respond with it’s poor craftsmen who blame their tools, but it really was differences in the kids.

  4. Dick Hall-Sizemore Avatar
    Dick Hall-Sizemore

    You are to be commended for posting data that does not “comport to the narrative [you] have pushed.” That said, you still reject data that “doesn’t square with what everyone knows to be true: to wit, that most Virginia K-12 students were given remote or hybrid instruction in the 2020-21 school year.” Therefore, you base your categorizations on how districts started out the 2020-2021 school year. However, many school districts that started out all virtual, such as Henrico, began to transition to in-school learning four days per week by mid-year. That surely helped mitigate the “damage”. It seems that the administration’s use of percentage of in-school instruction makes sense.

    Another surprise in the data. Most on this blog have bemoaned the damage done to Richmond city students. However, although they are still too low, the scores showed a “rebound” of more than 80 percent–not nearly as behind as many would have thought.

    1. Lefty665 Avatar

      To your last point, Richmond City started at 56.3%, fell to 47.3% then “recovered” to 47.2%. That “rebound” was an additional decline of .1%. Not a large further decline, but headed in the wrong direction and not what most would call a “rebound”. He tripped over a curb then rebounded by falling in a pothole.

      1. Dick Hall-Sizemore Avatar
        Dick Hall-Sizemore

        You are right. I was looking at the 83.8 percent rebound number, instead of the raw numbers. Shame on me. Still, Richmond did not experience as great a decline as some other jurisdictions. Maybe, it was already low as it could go.

        1. Lefty665 Avatar

          Percentages can be deceiving little buggers.

          I found when doing budgets that people would often fixate on large percentage increases in small numbers and the smaller percentage but large dollar changes in big numbers would go undiscussed. Human nature is funny stuff.

          Yeah, Richmond may be documenting the native proclivity of about half of students to learn despite what the school system does to them.

  5. Dick Hall-Sizemore Avatar
    Dick Hall-Sizemore

    You are to be commended for posting data that does not “comport to the narrative [you] have pushed.” That said, you still reject data that “doesn’t square with what everyone knows to be true: to wit, that most Virginia K-12 students were given remote or hybrid instruction in the 2020-21 school year.” Therefore, you base your categorizations on how districts started out the 2020-2021 school year. However, many school districts that started out all virtual, such as Henrico, began to transition to in-school learning four days per week by mid-year. That surely helped mitigate the “damage”. It seems that the administration’s use of percentage of in-school instruction makes sense.

    Another surprise in the data. Most on this blog have bemoaned the damage done to Richmond city students. However, although they are still too low, the scores showed a “rebound” of more than 80 percent–not nearly as behind as many would have thought.

  6. Nancy Naive Avatar
    Nancy Naive

    Hmmm, deadly to the sick and poor…

  7. LarrytheG Avatar
    LarrytheG

    Gotta give credit. Mostly fair and balanced with the caveat that the data is a little more complex.

    This also contradicts the “lost year, never regained” narrative that was well exercised in BR not that long ago.

    The thing not recognized or not wanting to be recognized is that no one really knew with any precision exactly how COVID “worked” and infected and so decisions were made based on fears that it was highly contagious even among kids. People are still arguing about that – but no one had perfect knowledge and some folks who also did have that knowledge were willing to bet the farm on in-person come hell or high water while they condemned those who had reservations.

    Sherlock has gone on and on about how great Virtual Virginia is especially the private-sector providers. It serves a significant number of kids “remotely” and apparently well.

    1. Kathleen Smith Avatar
      Kathleen Smith

      The data does show private providers. Virtual could have been a teacher in her classroom teaching some kids in person and other joined on a webcam. I think??

      1. LarrytheG Avatar
        LarrytheG

        Could have been if there was little chance of COVID disease spreading.

        What I don’t understand for the folks who insisted that schools do in-person is what they thought was going to happen to teachers and their own families including their parents if they contracted COVID.

        It was not like it was only schools that were involved.

        Restaurants, stores, DMV, hospitals, doctor and dentists offices , nursing homes, on and on – all were affected and experienced disease spread, hospitalizations and death.

        But the “in-person” folks seemed unaffected by the realities all around them in all other aspects of life that were adversely affected.

        for some reason, it was “okay” for teachers to do what not even the DMV or a Dentist office or virtually all govt office and private business offices would do.

        It made no sense. It was like an alternative reality.

        Schools HAD to do “in-person” or else even if many/most teachers were not going to do it. Anyone who thinks teacher shortages now is a problem, what would it have been if teachers had been forced to do in-person even as most parents were home themselves because of COVID. It was like , too bad, teachers have to do what no one else was being forced to do with COVID employment.

        AND they STILL say the same thing… i.e. ” we should have had in-person “… like COVID never happened….

        It made no sense then or now IMO.

    2. Kathleen Smith Avatar
      Kathleen Smith

      The data does show private providers. Virtual could have been a teacher in her classroom teaching some kids in person and other joined on a webcam. I think??

  8. Lefty665 Avatar

    Interesting numbers. One question is why would we expect institutions that are generally pretty stodgy in the first place to be agile at adopting an entirely new teaching methodology that depends on technical competence in both schools and each student’s home on short notice? It is much like the old joke about the talking dog. The wonder is not that he talks so well, but that he talks at all.

    Of the 11 systems that recovered well (99% or better of pre covid levels) Falls Church sticks out. First it was fully remote. Second it is always ranked right near the top of Virginia and national school systems. Third it is a small system, so there are fewer students to deal with. Fourth it is affluent, technically savvy and highly web connected. It is not a surprise it successfully adapted to remote learning, did not fall far and recovered well. We can exclude it from the analysis as an outlier.

    Of the 11 systems that recovered well, 6 were systems that were not so hot in the first place, they had passing percentages in the 60s and low 70s. They did not fall terribly far because they were not very high in the first place. They then recovered to about their prior mediocre levels. They can probably also be excluded from the analysis.

    One obvious variable, especially for rural counties, is the percentage of homes that have broadband access and the devices to access remote learning apps. Is there a high correlation between those rates and remote learning SOL scores?

    That leaves us with 4 of the top 11 that had pass rates in the 80s and recovered well. Of those Patrick and York counties were fully remote. We might be very interested in what they did right. Why did they thrive? Lexington city and Botetourt county were both partial in person which may help explain their resilience. Lexington city not only recovered but it improved considerably so that is interesting,

    Looking more closely at Patrick, York and Botetourt counties and the cities of Lexington and Falls Church may give us lessons in how to successfully adapt to dramatically changed educational circumstances.

    The bottom quartile has approaching half that were fully remote. That is probably a pretty good guide to places that did not cope well with the changes and challenges of remote education. Many of them also had starting rates in the 60s and 70s so they were not very good at teaching to begin with. One is left to wonder what went so wrong in Manassas city, Bath, and Highland counties that were fully in person yet suffered profoundly.

    Then, of course, in a class by themselves were Richmond and Danville that started in the low 50s, sank into the 40s and did not recover. They are lessons in how not to thrive in several different ways.

    1. These are exactly the kinds of questions we need to be asking.

      1. Kathleen Smith Avatar
        Kathleen Smith

        You are so right!

      2. Lefty665 Avatar

        Your work with the numbers makes it easy to pick things out.

        Can you sort the tables? If you can it would be interesting to see how/if the colors cluster and how the quartiles vary when sorted on the three SOL score columns.

      3. LarrytheG Avatar
        LarrytheG

        more looking in the rear-view mirror….geeze…

        You guys… can you look ahead?

  9. James Wyatt Whitehead Avatar
    James Wyatt Whitehead

    Solutions to learning loss are coming from unexpected places. It would be wise to mine those teachers and find out what they did that worked so well.

    1. LarrytheG Avatar
      LarrytheG

      For all the gloom and doom about “lost generations” and other various drama… looks like we’re on track to get back to where we were not-withstanding the screeching naysayer owls and such. Of course, in their minds, public education is still a massive failure and needs to be burned down anyhow.

  10. killerhertz Avatar
    killerhertz

    We already know that COVID disproportionately affected low income people. It’s probably worth weighting/adjusting for that.

Leave a Reply