Explaining Richmond’s Crazy Dropout Rates

by James A. Bacon

It is widely acknowledged by scholars on the Left and Right that there is a strong correlation between a high school student’s socioeconomic status and his or her propensity for dropping out. The generalization makes intuitive sense, and there is ample data to back it up. Across Virginia, 7% of economically disadvantaged (ED) students fly the coop before they graduate. Only 4% of their not-disadvantaged peers (NED) do.

But the Richmond City public school system is an anomaly, as John Butcher, publisher of Cranky’s Blog, has found in his relentless probing of school-system statistics.

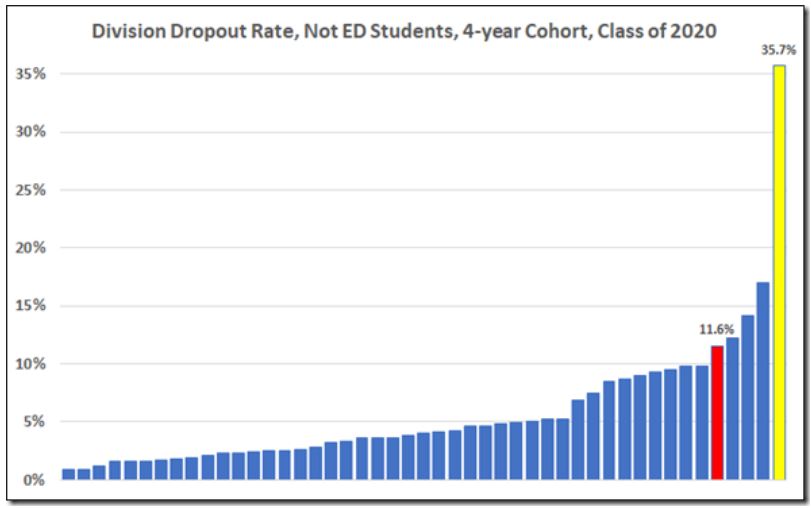
Thirteen percent of Richmond’s disadvantaged students quit the school system before graduating. That’s a miserable performance; the dropout rate is about 1.8 times that for all disadvantaged students across the state. But get a load of this: 36% of students who are Not Disadvantaged depart before they graduate. That’s a mind-blowing nine times higher than the state average for that group, and nearly three times the rate for ED students. 

City of Richmond high schools appear to be doing a uniquely bad job for students who are not laboring under the burden of being economically disadvantaged — the students whom one would hope would have a better chance of escaping the giant sucking sound of educational dysfunction. No other school system comes close in failing its NED students, as can be seen in this graph, which shows the rates for all school systems reporting 10 or more dropouts. Richmond is the yellow bar.

Source: Cranky’s Blog

Cranky points to budget cuts for truant officers as one possible explanation. City schools have fewer officers dragging kids back into school. Perhaps… but I suspect that there’s more to the story.

Some clues appear in the demographic breakdown of the dropouts. A perusal of the Virginia Department of Education data shows that Richmond dropouts are dominated by Hispanic students and English learners, two groups with significant overlap. Of the 350 dropouts in the Class of 2020 cohort, 204 were Hispanic and 194 were English learners. Only 122 were black, who were three times more numerous in the school system than Hispanics. Only 11 dropouts were white, and the number of Asians was so small it was suppressed in the data.

Another clue: 220 dropouts were male; only 130 were females.

Hypothesis: male high-school Hispanics are an exceptionally high-risk group for dropping out of school. The Hispanic sub-culture places a high priority on joining the workforce at an early age, and, I would conjecture, the pressure is even greater on boys than girls to start contributing to household income. If Hispanic students are deficient in English, they likely under-perform other groups academically, whether they are “disadvantaged” or “not disadvantaged.” More easily discouraged by their studies, they are less likely to see a return on investment in time and effort in continuing their education.

There may be more to the explanation for the high rate of NED dropouts, but I’ll bet this is part of it.

If I’m right, Richmond Public Schools might accomplish more good diverting funds from truancy-round-up initiatives to bulking up programs designed to help Hispanics with English-language deficiencies.

Note: I briefly published an earlier version of this post, thought better of it, and took it down. This version represents a significant re-write.


Share this article


ADVERTISEMENT

(comments below)


ADVERTISEMENT

(comments below)


Comments

44 responses to “Explaining Richmond’s Crazy Dropout Rates”

  1. No jokes, no levity, no wise-cracks.

    That is the most disturbing statistic I have ever seen regarding a public school system in Virginia. I’m trying to imagine the level of frustration, anguish and despair the children in that school system must be feeling for four (or more) out of every ten of them to leave without graduating.

    I don’t think the drop-out rate could be made much higher if the school administration was actively TRYING to drive students away.

    As far as I am concerned, the people who run the Richmond City schools are guilty of criminal-level neglect, if not intentional infliction of harm on the children they are entrusted to educate. I wish there was a way to identify those responsible and imprison them. They need to fire EVERYONE above the level of principal and start anew. Principals and teachers need to be held accountable, of course, but the problems in that school system have to be more basic than teaching methods and administration of individual schools.

    This is a positively abysmal situation – and beyond sad.

  2. LarrytheG Avatar

    What I would ask is if we can compare the urban areas of Virginia with high concentrations of ED to see if Richmond is truly uniquely bad or many urban schools in the inner city have similar issues.

    Some parts of Henrico that border Richmond have low performing schools also. How do they compare on these stats?

    1. https://www.wric.com/news/local-news/richmond/rps-data-shows-extremely-concerning-graduation-rate-for-latino-students/

      From last November. Richmond is the worst by a pretty wide margin. I will note that I was not able to verify that “fifty-four percent of Richmond’s disadvantaged students quit the school system before graduating” during my time at “Cranky’s” website. If the numbers really are lower than 54% then I suppose I must soften my above comments a bit- but not by much.

      The Richmond schools are still very bad. Their dropout rate is almost ten percentage points higher than the next worst system in Virginia (Norfolk). The graduation rates at other systems which might be considered “inner city” (Newport News and Hampton) are substantially higher even than Norfolk.

      https://www.nbc12.com/2019/10/10/va-schools-with-best-worst-graduation-rates/

      1. Nancy_Naive Avatar
        Nancy_Naive

        Well, it’s Richmond. All the Senators and Delegates gather there. That’s depressing.

      2. Nancy_Naive Avatar
        Nancy_Naive

        I’m disadvantaged trying to read this…

        https://p1pe.doe.virginia.gov/reportcard/show_report.do;jsessionid=fHN6x4uS_zOdcJCqJNM1DGjXpKTuz-D8Xe9RO7NoWOKBwDPyaX_l!1725724029!517432287?report_id=state-level-cohort-report&report_format=xlsx&year=2020&ratetype=4&link=division

        on a stupid iPad, but it’s easy to confirm that it sucks to be Hispanic in RCity schools with a 33% ontime graduation rate. I’ll have to download that on my XP box to do anything more than squint at it.

        They list “Economically Disadvantaged” and “Economically Disadvantaged anytime” (?,NN) having “on time graduation rates” of 79% and 76% respectively.

        Somebody needs to explain that 54%.

  3. I dunno, Larry. Why don’t you find out and tell us? Instead of trying to sew seeds of doubt about the conclusions in the prior posts. Tuquoque, Larry?

    1. LarrytheG Avatar

      does it look like the dropout rate for those who are not economically disadvantaged is 3 times the ED rate? Something is funky.

      1. Nancy_Naive Avatar
        Nancy_Naive

        Having to flip back and forth and squint to read the data…

        All students 1506 with 350 dropouts
        ED(anytime) 1081 with 184 dropouts. 17% dropout rate
        That means
        NED 425 with 166 dropouts. 38% dropout rate, so ~2.25 times.

        Not 3, but really, at this value still bad.

    2. Nancy_Naive Avatar
      Nancy_Naive

      Tuquoque? Or did you mean Torquemada?

  4. wonderbread Avatar
    wonderbread

    Looking deeper into the data, the shocking numbers are for Hispanic and English learner populations. ~30% graduation rate, and 65% dropout rate. I’d guess the weirdness in ED/not ED graduation rates are driven by this.

    I have no earthly idea what the story there is…is there something uniquely transient about Richmond City’s Hispanic population that they don’t transfer when leaving? Does the city capture data differently than peers? Are Richmond schools just this criminally bad at serving English learner children?

    But either way, it points to an enormous opportunity, and one that doesn’t fit neatly into the white/black narratives that drive our city’s politics.

  5. djrippert Avatar

    In simple terms, I don’t believe the statistic. I believe that “Cranky” (i.e. John Butcher) is reporting what he sees and I believe that Jim Bacon is properly recounting Cranky’s analysis. I just don’t believe the number is right. Let’s be honest – whether it’s COVID testing, COVID deaths or any number of other matters – Virginia’s data tracking leaves a lot to be deserved.

  6. James Wyatt Whitehead V Avatar
    James Wyatt Whitehead V

    The school board should not renew Superintendent Kamras contract. Too many failures to point out. There is no time to see if another 3 or 4 years of this experiment will work out as advertised. I remember back in the 1990s DC public schools turned to General Junius Becton. The schools began a slow but steady improvement out of the abyss. His no nonsense leadership helped turn the corner.

    Fighting the dropout problem is going to be tough. First thing. Open the schools. That by itself will take care of some of the problem. Second, hire a judge and an army of truant officers to deal specifically with attendance. Third make reading/writing the first and most important test score. Get some ESL teachers and the reading specialists on the payroll. Fourth, target the 14-17 year old high risk kids. Many of the dropouts will end up in the criminal justice system. This report, page 50, points to the 9th and 10th grade as the critical grade level before admissions to juvenile court system.
    http://www.djj.virginia.gov/pdf/admin/Profiles_of_Committed_Youth.pdf

  7. Steve Haner Avatar
    Steve Haner

    This was like a Twilight Zone piece, appearing and disappearing over and over the past two days. Curious what caused Jim to keep pulling it down and re-posting it…

    Since the re-write focuses on Hispanic youth, now the question is whether that pattern repeats in other places. That Jeff Davis (soon to be re-named) corridor south of the city extends well into Chesterfield, too. Are Chesterfield’s Hispanic neighborhoods also the scene of heavy dropout numbers? Other concentrations in VA?

    1. First time I took down the post can be attributed to poster’s regret. Like Rippert, I was suspicious of the numbers and not satisfied with the conclusions I drew, so I took it down.

      I delayed publication by 24 hours thinking that I would get back to the post before by then. But I got distracted, and the piece auto-posted after 24 hours. When I noticed, I took it down again, re-wrote the piece, and published for the third time!

      1. Nancy_Naive Avatar
        Nancy_Naive

        Well, your guess work on Hispanic culture is probably wrong, but the on-time graduation rate for Hispanics was 33%. Now, where the others went is anyone’s guess. I don’t trust that they tracked movement and reasons well enough for you to guess at anything.

        Hell, for all we know, the 200 Hispanic dropouts may be NYC Advanced Regents graduates.

        1. Matt Hurt Avatar

          Typically, whenever a student enrolls in a new school, they are asked to disclose the student’s previous school. The new school will then request records from the previous school. When this happens, the previous school codes the student as a transfer, which would exclude the student from the dropout calculation. The new school is very eager to receive he records from the previous school to determine what the student needs in order to graduate. The previous school is very eager to mark the student as a transfer so he/she won’t show up as a dropout. All that being said, there can certainly be human errors that would ensure the data is not 100% accurate, but there is so much focus on graduation rates, folks really take pains to keep up with this. The idea that significant numbers of kids transferred to another state/division and were not accounted for seems unreasonable to me.

  8. Nancy_Naive Avatar
    Nancy_Naive

    Not 2 decades, but Male Hispanic dropout (whatever that means) rate for Richmond City…

    Cohort Year Division Number Division Name Rate Type Race Gender Dropout Rate
    2009 123 Richmond City 4 yr rate Hispanic M 57.14%
    2010 123 Richmond City 4 yr rate Hispanic M 41.67%
    2011 123 Richmond City 4 yr rate Hispanic M 34.48%
    2012 123 Richmond City 4 yr rate Hispanic M 47.62%
    2013 123 Richmond City 4 yr rate Hispanic M 45.45%
    2014 123 Richmond City 4 yr rate Hispanic M 36.00%
    2015 123 Richmond City 4 yr rate Hispanic M 25.00%
    2016 123 Richmond City 4 yr rate Hispanic M 42.31%
    2017 123 Richmond City 4 yr rate Hispanic M 63.41%
    2018 123 Richmond City 4 yr rate Hispanic M 69.30%
    2019 123 Richmond City 4 yr rate Hispanic M 63.35%

  9. Nancy_Naive Avatar
    Nancy_Naive

    What’s it look like yoy for the past two decades?

  10. James Wyatt Whitehead V Avatar
    James Wyatt Whitehead V

    Those kids are working. Some are making more cash by now than I ever did with 2 college degrees. Mama don’t let your babies grow up to be school teachers.

    1. Nancy_Naive Avatar
      Nancy_Naive

      My daughter’s first boyfriend was an Hispanic 1st gen born USA. He worked scallop boats his summers in the last years of high school and first years at college. He made $27,000 in less than 3 months each of those years. (Plus, he gave me 10 lbs of fresh scallops one year).

      1. James Wyatt Whitehead V Avatar
        James Wyatt Whitehead V

        One of my former students, Vittorio. Everybody got a nickname in my class. I called him Duro Ha, or hard hat. He was a roofer after school. Pushed up to foreman. I could not convince this guy to stick with the 11th grade. He owns his own roofing company now in Loudoun. Drives a nice Dodge Challenger. I never could convince him that George Washington was from Virginia, Hard Hat insisted he was from El Salvador. Uncle.

  11. Nancy_Naive Avatar
    Nancy_Naive

    Not 2 decades, but Male Hispanic dropout (whatever that means) rate for Richmond City…

    Cohort Year Division Number Division Name Rate Type Race Gender Dropout Rate
    2009 123 Richmond City 4 yr rate Hispanic M 57.14%
    2010 123 Richmond City 4 yr rate Hispanic M 41.67%
    2011 123 Richmond City 4 yr rate Hispanic M 34.48%
    2012 123 Richmond City 4 yr rate Hispanic M 47.62%
    2013 123 Richmond City 4 yr rate Hispanic M 45.45%
    2014 123 Richmond City 4 yr rate Hispanic M 36.00%
    2015 123 Richmond City 4 yr rate Hispanic M 25.00%
    2016 123 Richmond City 4 yr rate Hispanic M 42.31%
    2017 123 Richmond City 4 yr rate Hispanic M 63.41%
    2018 123 Richmond City 4 yr rate Hispanic M 69.30%
    2019 123 Richmond City 4 yr rate Hispanic M 63.35%

    1. Steve Haner Avatar
      Steve Haner

      Well, if you were engaged enough to look that up, did you see any other locality’s numbers? Statewide median?

      1. Nancy_Naive Avatar
        Nancy_Naive

        YWIMC,
        Cohort Year Type Rate Type Race Gender Dropout Rate
        2011 4 yr rate Hispanic M 17.65%
        2012. 4 yr rate Hispanic M 16.64%
        2013 4 yr rate Hispanic M 14.27%
        2014 4 yr rate Hispanic M 14.24%
        2015 4 yr rate Hispanic M 13.69%
        2016 4 yr rate Hispanic M 16.30%
        2017 4 yr rate Hispanic M 20.39%
        2018. 4 yr rate Hispanic M 19.64%
        2019 4 yr rate Hispanic M 20.05%
        2020 4 yr rate Hispanic M 19.49%

        What school/district would you like?

        1. LarrytheG Avatar

          Good data. Similarly, if you look at other high schools in Virginia , (like Fairfax), some have similar not-good numbers for kids that don’t have English as their primary language nor kids of lower socio-economical status.

          It takes special additional and expensive staff to teach these kids and some schools don’t have the resources and I don’t recall seeing such staff as part of the SOQ positions.

          Cranky and Jim have basically had it in for Richmond schools for years. It’s one of Cranky’s continuing focus. Richmond does have persistent problems. Some of it is no doubt to the leadership but some of it is just a ton of socio-economic and I’d bet dollars to donuts that no Charter type school is actually going to “fix” the problem. The charters want certain rules that would wash out a lot of the problem kids, i.e. send them back to the public schools to deal with similar to what the Success Academies do it NYC. They save a few – a small number relative to the much larger number.

          When a significant percentage of a high school is these kids – it’s a no-win situation. The better, more talented teachers won’t get paid any more to take on this job and many just prefer to go teach at schools where there are not these kinds of problems.

          But the critics like to keep on flogging as if they actually have a “solution” beyond charters.

          Finally, these kids grow up, grossly lacking in enough education for anything other than low-skilled labor jobs – and guess what? They will have chaotic lives often with criminal justice AND they also will have kids and the cycle will repeat.

          The question is – is this the answer:

          https://i.pinimg.com/originals/7c/e9/a0/7ce9a0290be43e88be4cd8bcd72f6d18.jpg

          1. Nancy_Naive Avatar
            Nancy_Naive

            Ah cherry picking… worked for Healthcare Insurance companies for decades. Good exclusion rules can make poop look like a, well, cherry pie.

      2. wonderbread Avatar
        wonderbread

        When I looked originally, I looked at Chesterfield and they were much much better, and the state generally in the high 80s+ for graduation rate (as I recall).

        There’s something weird and Richmond City specific going on here, but I lack the knowledge to say what except that you can’t draw the ED/not-ED conclusions Cranky (and Jim) did until you can nail that down.

        1. LarrytheG Avatar

          It’s possible that Richmond is screwing with the data or that somehow, it’s true – and , in turn, unlike the data from other schools but one way to show that would be to show some other schools data – that have similar low numbers but different from Richmond perhaps.

          It would not be the first time that some school or school system messed with things they should not have – like SOL testing, etc.

          Matt Hurt from Wise County and a face of CIP has opined that the culture of a school has a lot to do with it’s performance and I would find that reasonable but then ask about schools that do have performance problems and what the common thread is – and he cites a series of things working separately and in concert that contribute.

          But beyond that, if that school is serving a neighborhood which has a high percentage of low socio-economic household, the challenges the school faces is enormous not the least of which is trying to attract highly effective teachers who actually have a choice where they would teach and Richmond would not be the first choice for many of them.

          We can flog Richmond repeatedly but to what purpose when the most frequently mentioned solutions are to fire everyone and/or stand up charter schools who will only take the most compliant kids and parents.

          It’s not like Richmond is unique. Look at some of the schools in other urban areas of the country, Terrible is the word and they talk about teacher unions as if no one can be fired. Not true Leadership CAN be fired but then the blame falls on the unions. Well, tell me , if you COULD fire those teachers, who would take their place KNOWING they’d be fired also if they did not “perform”?

          There are no easy solutions to this. It’s endemic in our socio-economics to a large extent and the challenge is can we help those kids in those circumstances escape the fate of their parents. “Blame” won’t do that.

  12. Nancy_Naive Avatar
    Nancy_Naive

    Again, in a quick perusal (I would use “scan” but such a weird word, it is a self-antonym), I could not find any definition of “dropout” that showed the VDoE did any tracking of a “dropout” that would account for cases where the student would have completed in some other type of school or equivalent program — on time, or otherwise.

    Given that, James’ rumination on cultural mystique of the Hispanic population numbers *might* also be tempered by mobility. Dodging ICE may play a role (Joke), but an itinerant workforce might explain some of the numbers. The 4-yr cohort could mean mom & dad have to be anchored to the district, maybe even the state, for 9-12 to complete on-time for the school/district.

    I’m sure one could get some idea of mobility by race from Bureau of Labor & Statistics… anyone?

    1. Matt Hurt Avatar

      Dropout is defined as a student who has not completed any type of program (diploma, GED, etc), and is not enrolled in any other school, division, or state.

  13. LarrytheG Avatar

    The schools provide the data, VDOE actually makes it relatively easy to get troves of data.

    That data reflects the issues , much like VDOT provides congestion and crash data.

    The difference is that we sometimes seem to expect the conditions to improve and/or we highlight extreme cases and ones that persist in schools but in a way it’s sorta like saying VDOT should “fix” congestion and if congestion is chronic it means VDOT fails.

    Similarly, with schools. When the parents have terrible educations and language/cultural issues to boot – we judge the schools as failures if they don’t “fix” it.

    Teachers tell me you can’t easily “fix” when johnny moves between households and even schools when mom loses her job or dad gets imprisoned, etc.

    These are societal problems that schools cannot easily “fix” and a lot of times, the data reflects the socio-economic status of the neighborhoods they serve. Finding skilled staff for these schools is hard. Teachers can teach anywhere they want and most would not voluntarily choose a place like Richmond – even in a Charter unless the Charter can kick out any kids who them and their parents won’t conform to strict rules.

    There are no easy answers. Telling parents to “shape up or else” is a nice concept with a similarly high “failure” rate. People with low education and skills often live chaotic lives as a result and the question becomes how many kids in those situations be “helped” to overcome them.

    It’s not a job for your average teacher or average school serving a neighborhood of 50-100K income households.

    So the continued flogging seems pointless sometimes… what does it solve?

  14. Matt Hurt Avatar

    After reading this article, I thought it would be interesting to see how Richmond’s 4 year graduation rate trend compared to the state as a whole. Dropout rate is the negative view of this metric, so I wanted to see what the positive view (graduation rate) looked like. I would really like to understand the roller coaster trend in Richmond, especially compared to the consistently improving trend across the state.

    https://www.baconsrebellion.com/app/uploads/2021/02/on-time-graduation-rates.png

    One factor that surely impacts the outcomes is that Richmond has high staff turnover rates. Other divisions do as well, but from the sources I can find, it looks like they turnover about 20% annually, which is crazy. As far as I know, the state doesn’t publish this type of data, and it would certainly be interesting to view this metric for all divisions.

    For example, school counselors in most schools play a critical role in tracking student graduation requirements through the high school grades. Many of these folks build relationships with their students, and they work diligently to keep these kids on the straight and narrow path towards graduation. If there’s a revolving door in the guidance office to accommodate significant turnover of school counselors, how can these relationships be maintained?

    I’m thinking that if Richmond does have this extremely high rate of annual staff turnover, it will be very difficult to effectively address the other issues until that problem is mitigated. I am very curious to find out what degree staff turnover affects these negative outcomes, as well as how to fix that problem.

  15. Nancy_Naive Avatar
    Nancy_Naive

    Again, in a quick perusal (I would use “scan” but such a weird word, it is a self-antonym), I could not find any definition of “dropout” that showed the VDoE did any tracking of a “dropout” that would account for cases where the student would have completed in some other type of school or equivalent program — on time, or otherwise.

    Given that, James’ rumination on cultural mystique of the Hispanic population numbers *might* also be tempered by mobility. Dodging ICE may play a role (Joke), but an itinerant workforce might explain some of the numbers. The 4-yr cohort could mean mom & dad have to be anchored to the district, maybe even the state, for 9-12 to complete on-time for the school/district.

    I’m sure one could get some idea of mobility by race from Bureau of Labor & Statistics… anyone?

    1. Matt Hurt Avatar

      Dropout is defined as a student who has not completed any type of program (diploma, GED, etc), and is not enrolled in any other school, division, or state.

      1. Nancy_Naive Avatar
        Nancy_Naive

        Anecdotally, that’s a kind of definition… but, and again, not a thorough search, I did not verify that VDoE used that definition.

        If they did, would they not have a category of “left cohort finished on-time”?

        If you could, and did, track the student that well, then why would you not report that information? The void is defined by its boundaries.

        1. LarrytheG Avatar

          yep…. the whole issue is a data quagmire…. just google some of the terms and phrases.

          It started with “No Child left Behind” with a simplistic notion but then all kinds of related issues got in the tangle..

          The experience of the Success Academies shows some of this:

          “Success Academy graduates 16 students at its inaugural commencement

          This graduating class started off with 73 students when the network launched, according to the Wall Street Journal. Critics have said that Success pushes out students who are the toughest to serve, such as those with behavioral challenges — something the network adamantly denies.”

          https://ny.chalkbeat.org/2018/6/7/21105493/success-academy-graduates-16-students-at-its-inaugural-commencement

        2. Matt Hurt Avatar

          VDOE doesn’t always publish their calculation criteria to allow folks to accurately replicate the different accountability rates, even if you have access to all of the raw data. The documentation that provides the greatest insight into this is linked below. It is found on the secure side of VDOE’s website, but is certainly FOIA-able. Even this document doesn’t explain that fully. I learned the specifics by asking questions to folks at VDOE and then applying their answers to our data. Sometimes I’d have to ask more than one person to get the right answer. When my reports matched theirs, that let me know that I figured out their methodology.
          https://drive.google.com/file/d/1pfNsYoeyxK1qrOkjOaE8JzAe_PBcAVYg/view?usp=sharing

          1. LarrytheG Avatar

            Thanks for providing that. I can’t but help think in reading through it that some Conservative types normally would rail mightily against using paid staff resources (administrators) to bean-count instead of “teach”!!

            😉

      2. Nancy_Naive Avatar
        Nancy_Naive

        The “cohort” is the set of 9th graders who are grouped by district/school. If a member moves to Norfolk from Richmond in the 10th grade and completes or drops out, then in which district are those results booked?

        There’s NOTHING in the data sets that indicates such a common situation of moving, nor tracking, done.

        1. Matt Hurt Avatar

          The student counts towards the rates in the last school/division in which they were enrolled. You’re exactly right, VDOE doesn’t control for transient students. A student can enroll into a division on Monday, not show up again, and 15 days later will be dropped from the roll. That one day of attendance caused the student to count as a dropout for that division/school.

          1. Nancy_Naive Avatar
            Nancy_Naive

            They need a bit bucket.

  16. LarrytheG Avatar

    The schools provide the data, VDOE actually makes it relatively easy to get troves of data.

    That data reflects the issues , much like VDOT provides congestion and crash data.

    The difference is that we sometimes seem to expect the conditions to improve and/or we highlight extreme cases and ones that persist in schools but in a way it’s sorta like saying VDOT should “fix” congestion and if congestion is chronic it means VDOT fails.

    Similarly, with schools. When the parents have terrible educations and language/cultural issues to boot – we judge the schools as failures if they don’t “fix” it.

    Teachers tell me you can’t easily “fix” when johnny moves between households and even schools when mom loses her job or dad gets imprisoned, etc.

    These are societal problems that schools cannot easily “fix” and a lot of times, the data reflects the socio-economic status of the neighborhoods they serve. Finding skilled staff for these schools is hard. Teachers can teach anywhere they want and most would not voluntarily choose a place like Richmond – even in a Charter unless the Charter can kick out any kids who them and their parents won’t conform to strict rules.

    There are no easy answers. Telling parents to “shape up or else” is a nice concept with a similarly high “failure” rate. People with low education and skills often live chaotic lives as a result and the question becomes how many kids in those situations be “helped” to overcome them.

    It’s not a job for your average teacher or average school serving a neighborhood of 50-100K income households.

    So the continued flogging seems pointless sometimes… what does it solve?

  17. Matt Hurt Avatar

    After reading this article, I thought it would be interesting to see how Richmond’s 4 year graduation rate trend compared to the state as a whole. Dropout rate is the negative view of this metric, so I wanted to see what the positive view (graduation rate) looked like. I would really like to understand the roller coaster trend in Richmond, especially compared to the consistently improving trend across the state.

    https://www.baconsrebellion.com/app/uploads/2021/02/on-time-graduation-rates.png

    One factor that surely impacts the outcomes is that Richmond has high staff turnover rates. Other divisions do as well, but from the sources I can find, it looks like they turnover about 20% annually, which is crazy. As far as I know, the state doesn’t publish this type of data, and it would certainly be interesting to view this metric for all divisions.

    For example, school counselors in most schools play a critical role in tracking student graduation requirements through the high school grades. Many of these folks build relationships with their students, and they work diligently to keep these kids on the straight and narrow path towards graduation. If there’s a revolving door in the guidance office to accommodate significant turnover of school counselors, how can these relationships be maintained?

    I’m thinking that if Richmond does have this extremely high rate of annual staff turnover, it will be very difficult to effectively address the other issues until that problem is mitigated. I am very curious to find out what degree staff turnover affects these negative outcomes, as well as how to fix that problem.

Leave a Reply