
by James C. Sherlock
With the interest shown in my last post, I think it will prove interesting to this audience to see the distribution of business starts by political jurisdiction in Virginia along with some data to ponder.
The preparation
I have put together a spreadsheet sourced from the census bureau, and then added the 2019 census population of each jurisdiction to that spreadsheet.
I then divided the population of each jurisdiction in 2019 by the business starts in each jurisdiction in 2019 to come up with a measure of the intensity of business starts in each jurisdiction.
Then I added the median household income of each jurisdiction.
The results might surprise you, might not. Especially remember these are only snapshots of partial data.
What is missing
I do not include population gain/loss, business failures, trends from 2005 (though I downloaded every year), location in the state, special conditions like the I-95 effect in Emporia, metro area effects on some smaller jurisdictions in large metro areas, and much other data that it would take to make a comprehensive business assessment for each of these 133 jurisdictions.
What you will see
But I think you will find it interesting anyway.
You will see what may appear to be results difficult to explain. Certainly each business start wherever it is must have capital, labor, a market (or a perceived market), skills assessment (can this be done here given the skill level of the business owner and his/her planned workforce), competition assessment and a business plan, even a rudimentary one, that captures all of that and more.
The types of startups in remote counties may differ significantly from startups in growing metro areas. The cheap price of land and low wage work forces in rural counties are attractive to certain businesses. A growing customer base nearby and the competitive environment is more important to other types of businesses.
The Data
The City of Manassas had one business start in 2019 for each 31 residents. That was the highest rate in Virginia.
King and Queen County with one start for each 504 residents had the lowest rate.
There are 133 jurisdictions in Virginia. The top jurisdictions ranked by business starts in 2019 for each 100 residents are listed below in descending order with the 2018 median household income of each jurisdiction listed in parenthesis:
- Manassas city – one for each 31 residents ($78,462)
- King George County – one for each 33 residents ($87,321)
- Fairfax city – one for each 46 residents ($121,133)
- Falls Church city – one for each 63 residents ($124,796)
- Alexandria city – one for each 66 residents ($96,733)
- Richmond city – one for each 69 residents ($45,117)
- Fredericksburg city – one for each 70 residents ($63,274)
- Petersburg city – one for each 71 residents ($36,135)
- Emporia city – one for each 74 residents ($30,857)
- Loudoun County – one for each 75 residents ($136,268)
- Highland County – one for each 76 residents ($46,147)
- Charlottesville city – one for each 77 residents ($58,933)
- Virginia Beach city – one for each 77 residents ($74,186)
- Henrico County – one for each 79 residents ($68,572)
- Fairfax County – one for each 80 residents ($111,574)
- Arlington County – one for each 82 residents ($117,374)
- Prince William County – one for each 82 residents ($103,445)
- Chesterfield County – one for each 82 residents ($80,214)
- Portsmouth city – one for each 86 residents ($50,224)
- Goochland County – one for each 86 residents ($89,741)
- Hanover County – one for each 89 residents ($88,652)
- Hampton city – one for each 91 residents ($54,550)
- Suffolk city – one for each 91 residents ($70,664)
- Norfolk city – one for each 91 residents ($49,146)
- Stafford County – one for each 93 residents ($106,773)
- Charles City County – one for each 95 residents ($59,192)
- Newport News city – one for each 97 residents ($51,884)
The lowest ranked jurisdictions ranked by business starts in 2019 for each 100 residents were, in descending order from number 106:
- 107. Russell County – one for each 201 residents ($39,482)
- 108 Henry County – one for each 204 residents ($36,683)
- 109 Appomattox County – one for each 204 residents ($56,176 )
- 110 Galax city – one for each 205 residents ( $31,938)
- 111 King William County – one for each 205 residents ($68,720)
- 112 Pittsylvania County – one for each 205 residents ($45,382)
- 113 Buena Vista city – one for each 209 residents ($34,273)
- 114 Norton city – one for each 210 residents ($28,071)
- 115 Wythe County – one for each 217 residents ($48,043)
- 116 Southampton County – one for each 229 residents ($54,611)
- 117 Giles County – one for each 232 residents ($52,478)
- 118 Amherst County – one for each 232 residents ($49,170)
- 119 Craig County – one for each 233 residents ($55,484)
- 120 Smyth County – one for each 235 residents ($40,425
- 121 Bland County – one for each 242 residents ($50,511)
- 122 Carroll County – one for each 242 residents ($43,532)
- 123 Scott County – one for each 242 residents ($39,144)
- 124 Wise County – one for each 254 residents ($38,345)
- 125 Pulaski County – one for each 260 residents ($52,638)
- 126 Alleghany County – one for each 270 residents ($47,794)
- 127 Grayson County – one for each 273 residents ($33,969)
- 128 Radford city – one for each 277 residents ($36,743)
- 129 Buchanan County – one for each 288 residents ($30,806)
- 130 Covington city – one for each 291 residents ($39,432)
- 131 Lee County – one for each 312 residents ($32,718)
- 132 Dickenson County – one for each 398 residents ($29,226)
- 133 King and Queen County – one for each 504 residents ($54,516)
What does it mean?
So, think about if what you have assumed is proven or challenged by these data.
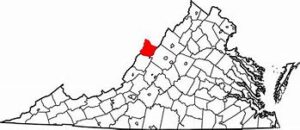
The most interesting jurisdiction on this whole list to me is Highland County.
It is tucked so far away in Northwest Virginia that it may be the most remote county in the state. It has a grand total of 2,190 citizens. Highland lays claim to being one of the least populous counties and one of the highest average elevations east of the Mississippi River. It is surrounded by national forests and not near an interstate. The West Virginia counties to which it is contiguous offer no help.
Yet it had 29 new business starts in 2019, and that number has averaged 20 per year for a decade.
Enjoy.
Leave a Reply
You must be logged in to post a comment.