by John Butcher

We’ve been hearing about the post-COVID declines in scores on the National Assessment of Educational Process (NAEP) tests. The NAEP database offers some (in fact, an abundance of) details.

Here, as a small sample, are the 4th and 8th grade reading and mathematics data for the nation and Virginia.

First, reading:

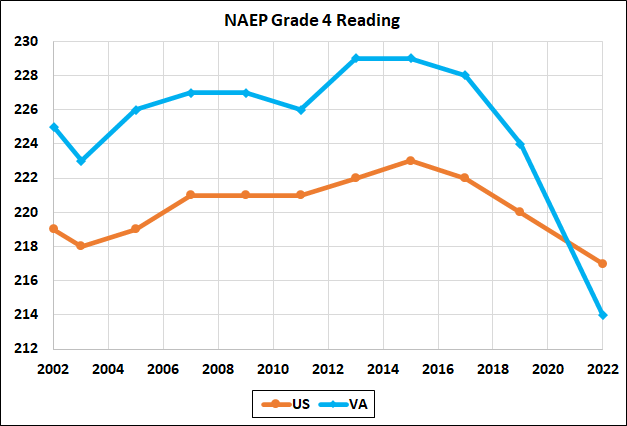
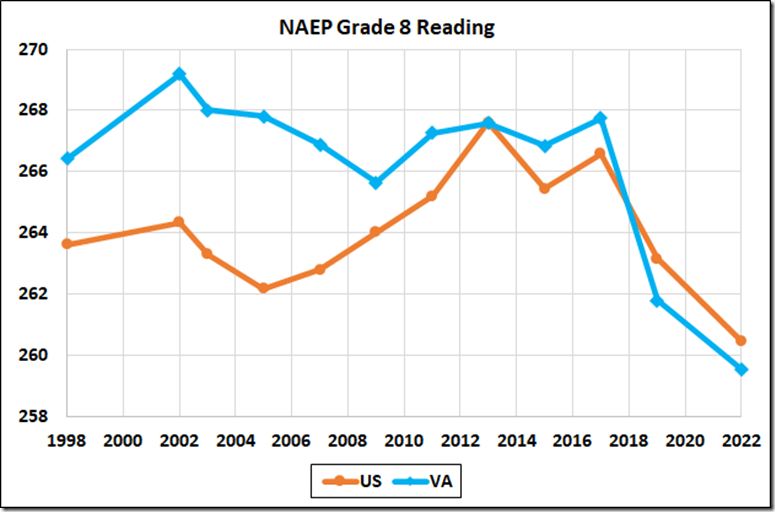
As to the fourth grade, it looks like the deterioration started in 2019 or perhaps even 2017. In any case, Virginia has lost its bragging rights vis-à-vis the national averages. The 2022 averages obliterate the gains since the 2002-2003 4th grade and the 1998 8th grade numbers.

Turning to the mathematics data:

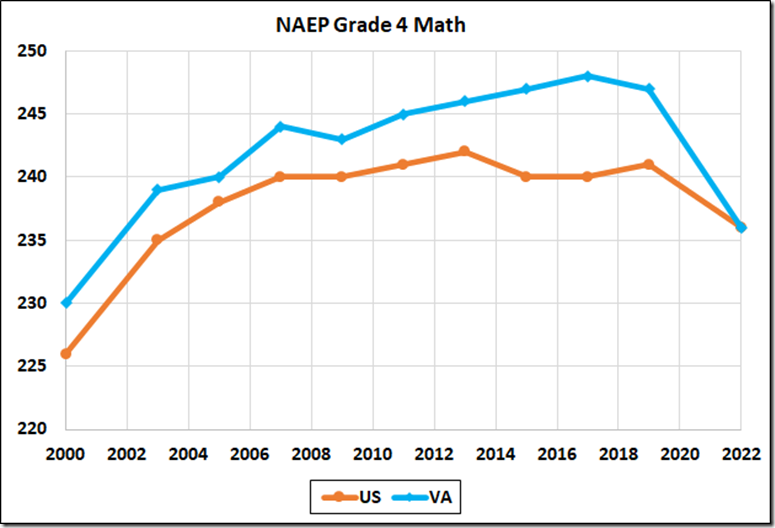
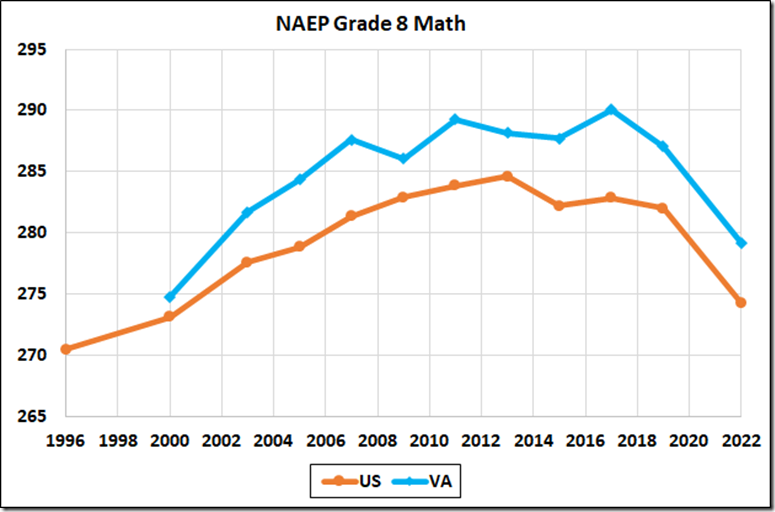
Looking for something good to say: these 2022 data are not quite as ugly as the reading numbers. Beyond that, notice that the Virginia NAEP results do not show any effect from the math SOL scoring boost in 2019.

OK, Secretary Guidera. The ball is in your court. For sure, the Board of “Education” has demonstrated that it does not know how to improve the numbers except by making the tests and/or grading easier.

John Butcher is a retired attorney living in the Richmond area. This column has been reprinted with permission from Cranky’s Blog.


Share this article


ADVERTISEMENT

(comments below)


ADVERTISEMENT

(comments below)


Comments

10 responses to “NAEP Before and After COVID”

  1. Dick Hall-Sizemore Avatar
    Dick Hall-Sizemore

    I was inspired by Butcher’s earlier article about the non-correlation between SOL scores and funding per pupil. This data is even more damning. Thanks for doing this work.

    1. Teddy007 Avatar
      Teddy007

      The easiest thing for a graduate student in statistics to do is show that there is no correlation between student per capita spending and test scores. Just look it up on the ERIC website.

  2. CJBova Avatar

    Shocking, but thank you, John Butcher! Shared with our school board candidates so they can see what they’re up against.

  3. James Wyatt Whitehead Avatar
    James Wyatt Whitehead

    Every school board should sign a pledge to guarantee uninterrupted instruction time for all core subjects. That will act alone could stop the hemorrhaging.
    https://www.baconsrebellion.com/what-the-minutes-say-about-public-education-in-virginia/

  4. Stephen Haner Avatar
    Stephen Haner

    Map it all against average daily screen time. Bets? Even the kids now back in school sit at their desks staring at screens, far more than a decade ago.

    And I’ll draft the pledge for the parents.

  5. Ronnie Chappell Avatar
    Ronnie Chappell

    Graphs that aren’t plotted with zero on the vertical axis make small changes look like much bigger ones. I once worked for a CEO who demanded that every graph shared with him and his directors include a zero axis.

    1. Teddy007 Avatar
      Teddy007

      Someone else was read “Hot to Lie with Statistics.

    2. WayneS Avatar

      If the maximum and minimum values of the data you are studying lie between two numbers which are significantly greater then zero, it is pointless to base the y-axis at zero..

      I’m assuming he did not demand that the x-axis always start at zero.

  6. Nancy Naive Avatar
    Nancy Naive

    The fall of civilization takes time, but they probably all begin with lowering SOLs. Well, that and giving hemlock to their teachers.

  7. Bob X from Texas Avatar
    Bob X from Texas

    Any child not up to grade standards should be going to summer school every summer until they catch up.

Leave a Reply