Money Don’t Buy You Learning

by John Butcher

It’s December. The Generous Assembly is about to return and the demands for more education funding (see Executive Summary at p.4) resound throughout the Commonwealth.

The data would suggest that these demands are misplaced.

VDOE won’t post the 2020 expenditure data until sometime this spring and there were no 2020 SOLs, so we’ll use the 2019 expenditure and SOL data. The expenditure numbers below are the those for “day school operation” (the sum of Administration, Instruction, Attendance and Health Services, Pupil Transportation, and O&M spending). Student counts are the year-end average daily membership.

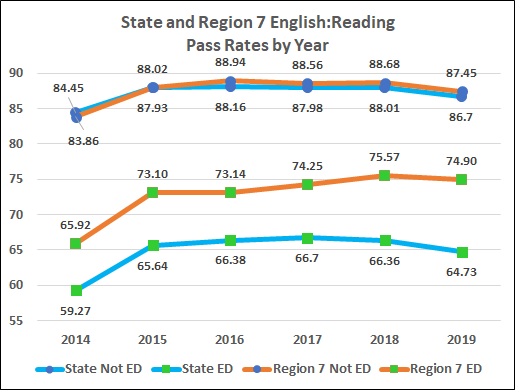
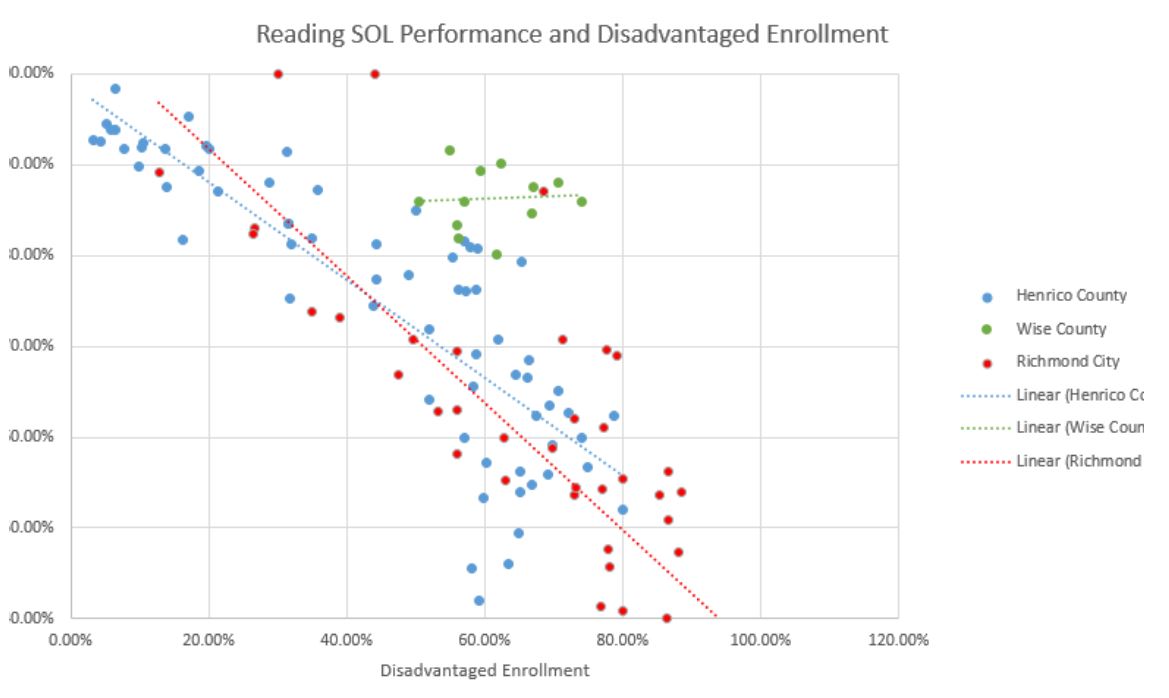
One wrinkle: Statewide, “economically disadvantaged” (here, “ED”) students underperform their more affluent peers (“Not ED”) by some 17 to 22 points, depending on the subject. Thus the division average pass rates depend both on student performance and the relative numbers of ED and Not ED students. We’ll avoid that issue here by looking at the rates for both groups.

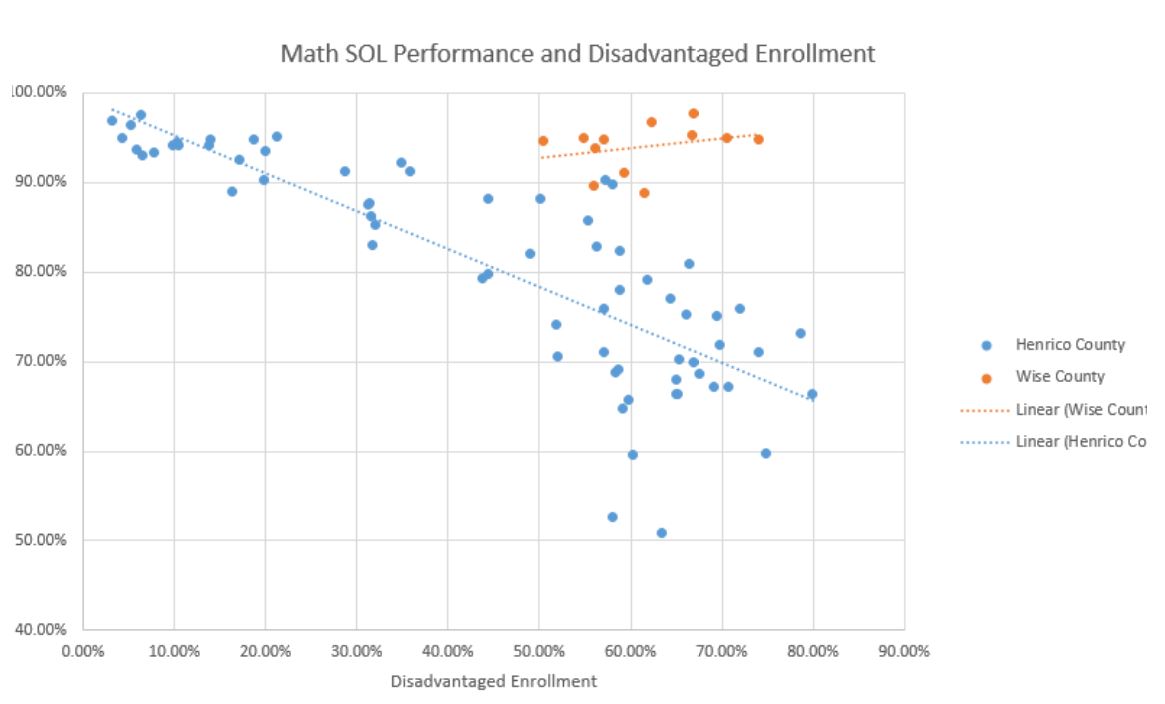
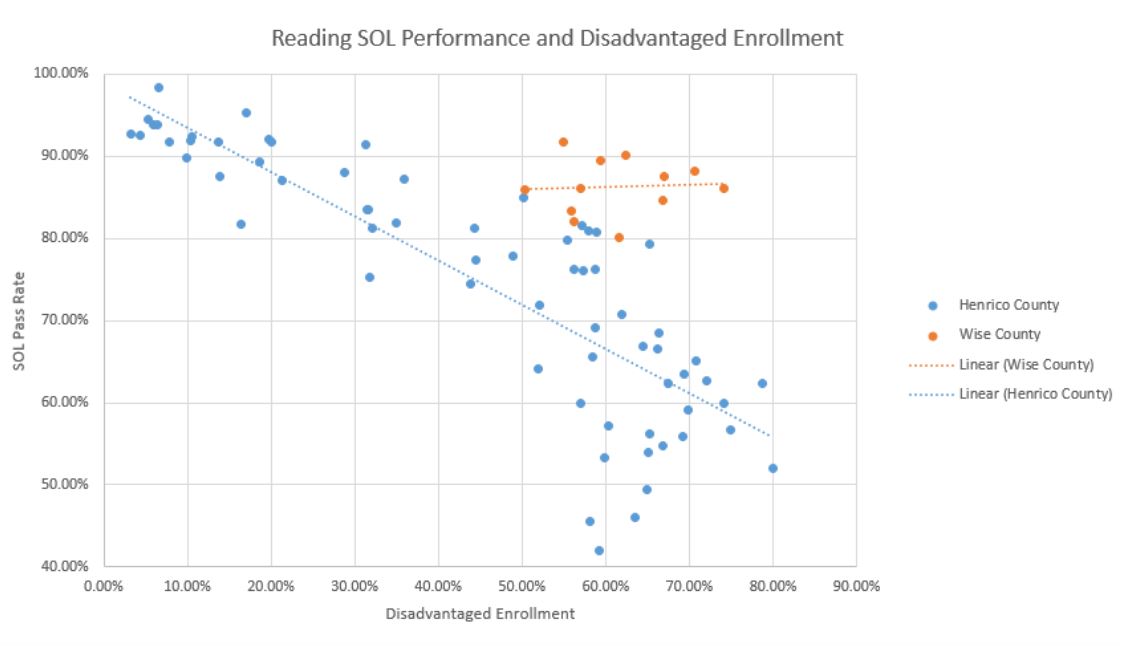
Here, then, are the division average reading pass rates for the two groups plotted v. the division day school expenditure per student:

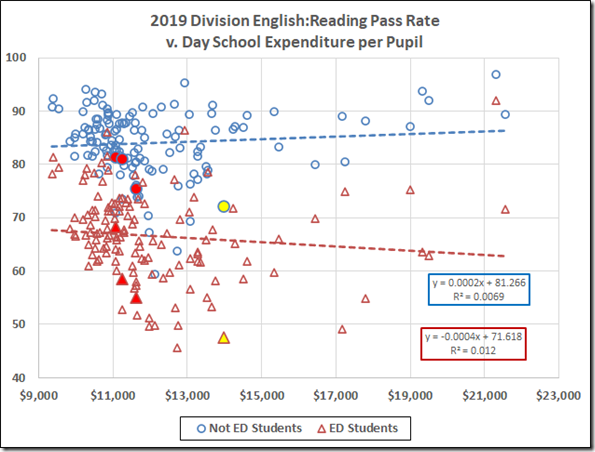
(Richmond is the enlarged point with yellow fill. The red-filled points are, from the left, the peer cities Hampton, Norfolk, and Newport News.

The fitted lines suggest that performance of the Not ED students increases slightly with expenditure (about 2% per $10,000) while the ED scores decrease (ca. 4% per $10,000). The R-squared values, however, tell us there is only a minuscule correlation between the pass rates and the expenditures.

We can get a clearer view of the data for Richmond and the peer cities by expanding the axis to hide the Very Big Spenders.

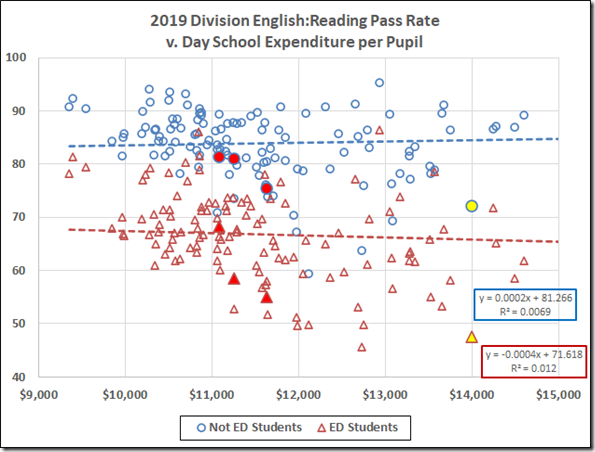
Need I say it? Richmond is spending well above average money and obtaining lousy results for both groups of students.

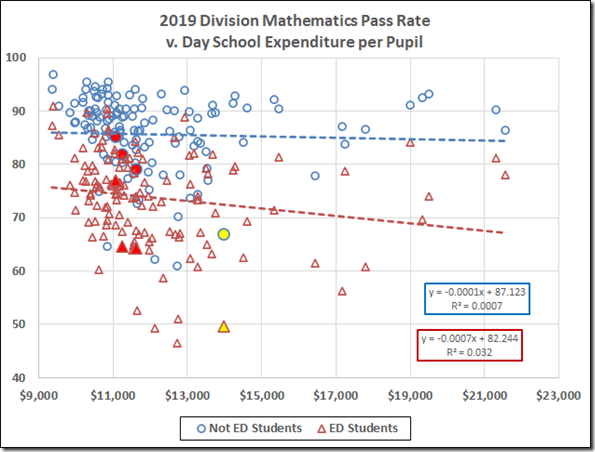
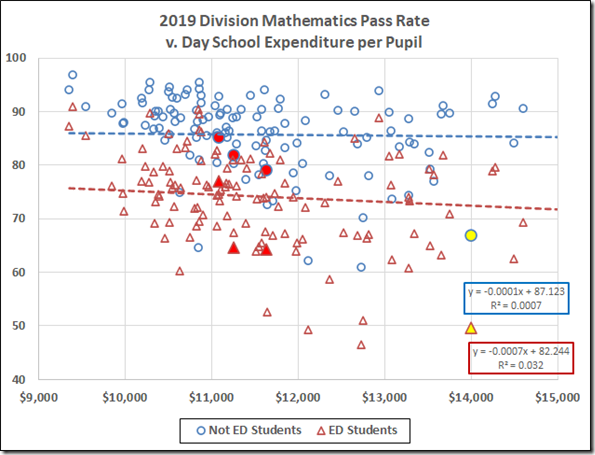
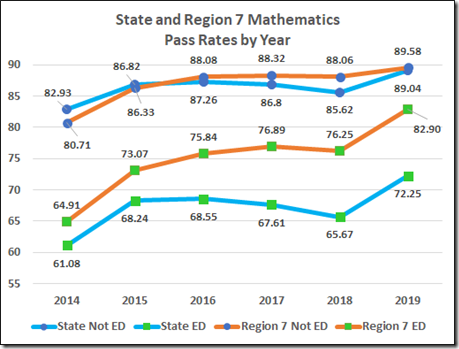
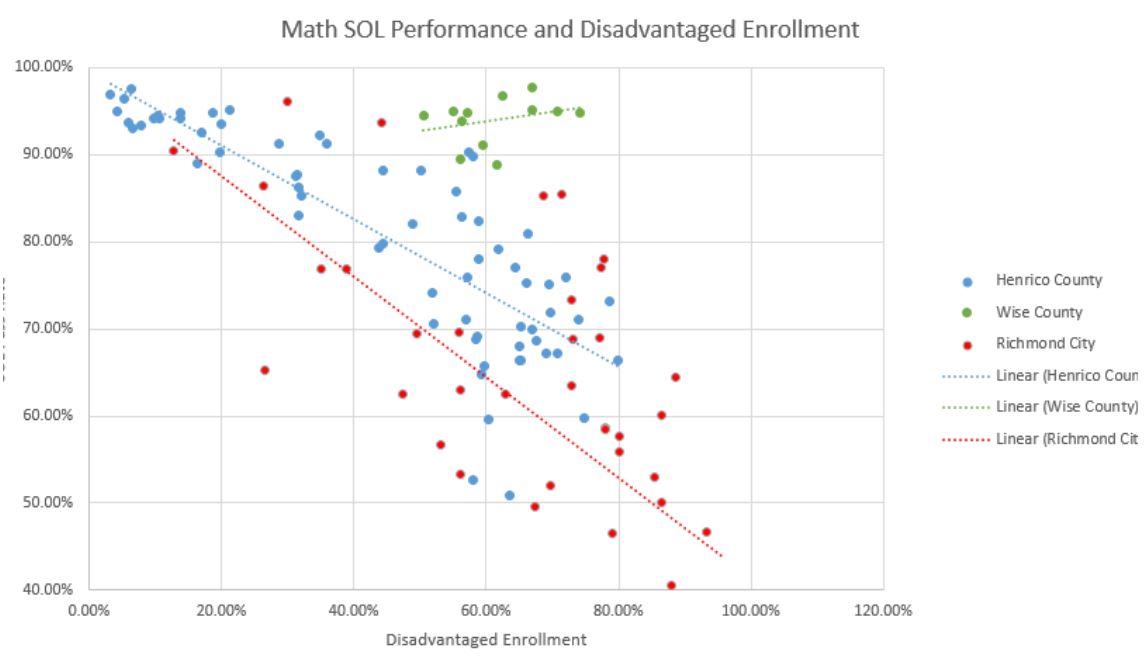
The math data tell the same story: More Money doesn’t correlate with more learning; Richmond spends a lot and gets awful pass rates.

As a pleasant contrast to that bad news, the (locally created and run) Comprehensive Instructional Plan has produced remarkable gains in the Southwest:

They’ve told us how they achieved this:

  • Identify the good teachers,
  • Share their materials and techniques,
  • Measure what works,
  • Focus on core skills,
  • Set high expectations,
  • Bond with the students, and
  • Use the feckless VDOE only for what it actually can do well: crunch numbers.

While the Generous Assembly is in town perhaps they will consider taking the school improvement budget that is wasted at VDOE and giving it to the CIP, where they know how to get results.

This article was republished with permission from Cranky’s Blog.


Share this article


ADVERTISEMENT

(comments below)


ADVERTISEMENT

(comments below)


Comments

121 responses to “Money Don’t Buy You Learning”

  1. Baconator with extra cheese Avatar
    Baconator with extra cheese

    Wrong…. like Jason Kamras has said… RVA is “different”…. they need extra super volumes of money to educate those victimized kids…. and replace black mold infested ceiling tiles.
    Maybe another century of woke leadership will erase the trauma and the kids can learn to read.
    But in reality the city schools are a lost cause. Live with it RVA voters… you’re getting exactly what you voted for…. now get ready to reap the rewards of zoom school for 18 months… a > 20% truancy rate, and a police force you vilified patroling your streets.
    At least you’ll have street cred in the rap game.

  2. Baconator with extra cheese Avatar
    Baconator with extra cheese

    Wrong…. like Jason Kamras has said… RVA is “different”…. they need extra super volumes of money to educate those victimized kids…. and replace black mold infested ceiling tiles.
    Maybe another century of woke leadership will erase the trauma and the kids can learn to read.
    But in reality the city schools are a lost cause. Live with it RVA voters… you’re getting exactly what you voted for…. now get ready to reap the rewards of zoom school for 18 months… a > 20% truancy rate, and a police force you vilified patroling your streets.
    At least you’ll have street cred in the rap game.

  3. Baconator with extra cheese Avatar
    Baconator with extra cheese

    I think RVA schools should get rid of all the white female teachers. It appears they may be the problem.
    I know teacher of the year Rodney has a organization with a mission to get Black men teaching.
    As the woke empty the jails of Black men they think were put there unjustly by white supremecy and systemic racism I propose they start a prison to elementary school teacher program. It seems to fit their narative and would be a win-win for RVA. Pass out some conditional licenses amd watch the children blossom under the guidance of the community’s elder statesmen.

  4. Baconator with extra cheese Avatar
    Baconator with extra cheese

    I think RVA schools should get rid of all the white female teachers. It appears they may be the problem.
    I know teacher of the year Rodney has a organization with a mission to get Black men teaching.
    As the woke empty the jails of Black men they think were put there unjustly by white supremecy and systemic racism I propose they start a prison to elementary school teacher program. It seems to fit their narative and would be a win-win for RVA. Pass out some conditional licenses amd watch the children blossom under the guidance of the community’s elder statesmen.

  5. LarrytheG Avatar

    Did not realize that the State provided data on a per student basis… such that one could actually break out Ed and not ED.

    Where is that data?

    1. Nancy_Naive Avatar
      Nancy_Naive

      Wait! At our age, ED is something entirely different.

      OTOH, I should think “not ED” would cause lower math scores. Oh well.

    2. I’ll assume you meant to ask “Where are those data?”

      The answer: Follow the link in the post,
      https://p1pe.doe.virginia.gov/apex/f?p=152:1:13031110399412:::::
      and select both Yes and No under Disadvantaged

      1. LarrytheG Avatar

        Yes, I see that but where does the funding per student data come from differentiated by ED?

        You’re just saying no matter how much money is spent on a per student basis – the gap stays the same or gets slightly worse – NOT that they are spending MORE on ED.

        Right?

        Now, if you showed there was no such gap for Charter, non-public , private schools, THEN YOU’d have something!

        😉

        1. Baconator with extra cheese Avatar
          Baconator with extra cheese

          The scores are Ed vs NonED… the funding is per pupil… not broken out by ED… that’s why the circle and triangles are in the same vertical plane.

  6. LarrytheG Avatar

    Did not realize that the State provided data on a per student basis… such that one could actually break out Ed and not ED.

    Where is that data?

    1. Nancy_Naive Avatar
      Nancy_Naive

      Wait! At our age, ED is something entirely different.

      OTOH, I should think “not ED” would cause lower math scores. Oh well.

    2. I’ll assume you meant to ask “Where are those data?”

      The answer: Follow the link in the post,
      https://p1pe.doe.virginia.gov/apex/f?p=152:1:13031110399412:::::
      and select both Yes and No under Disadvantaged

      1. LarrytheG Avatar

        Yes, I see that but where does the funding per student data come from differentiated by ED?

        You’re just saying no matter how much money is spent on a per student basis – the gap stays the same or gets slightly worse – NOT that they are spending MORE on ED.

        Right?

        Now, if you showed there was no such gap for Charter, non-public , private schools, THEN YOU’d have something!

        😉

        1. Baconator with extra cheese Avatar
          Baconator with extra cheese

          The scores are Ed vs NonED… the funding is per pupil… not broken out by ED… that’s why the circle and triangles are in the same vertical plane.

  7. LarrytheG Avatar

    Yep – on a per district basis – basically show the GAP persists but that’s known and not really shocking.

    ED kids do not learn when taught the way that non ED kids are taught and learn. Kapishe?

    CIP seems to do better – I admit. But there is some nagging concerns that CIP is really not formal. If you go to those schools sites, many do not seem to even acknowledge CIP.

    And they have all the same teachers!

  8. LarrytheG Avatar

    Yep – on a per district basis – basically show the GAP persists but that’s known and not really shocking.

    ED kids do not learn when taught the way that non ED kids are taught and learn. Kapishe?

    CIP seems to do better – I admit. But there is some nagging concerns that CIP is really not formal. If you go to those schools sites, many do not seem to even acknowledge CIP.

    And they have all the same teachers!

  9. Baconator with extra cheese Avatar
    Baconator with extra cheese

    Except in RVA that is even more apparent…. and RVA spends near the top per kid and gets some of the worst results ED or not.
    I say it must be the racist white female Democrat union teachers…. I mean it’s not money or the kids.

  10. Baconator with extra cheese Avatar
    Baconator with extra cheese

    Except in RVA that is even more apparent…. and RVA spends near the top per kid and gets some of the worst results ED or not.
    I say it must be the racist white female Democrat union teachers…. I mean it’s not money or the kids.

  11. LarrytheG Avatar

    It’s not rocket science. In any district where schools have high populations of ED , most teachers don’t want no part of it because it’s a losing proposition and the higher ups go looking for scapegoats when they get heat.

    Most teachers will find a school where that problem is not so bad.

    As far as I know, school districts cannot force teachers to teach at the “tough” schools – so they are forced to take whatever teachers they can find which are often newbies right out of college or older ones that other schools do not want.

    It’s a dirty little secret no one wants to talk about.

    In theory, every teacher is the “same” in terms of skill, qualifications, effectiveness, etc… districts are not allow to pay highly effective teachers “more” so they let them go to the school they want to teach at instead and most of them don’t want anything to do with teaching large classes of ED.

    I’ve said many times – that if private schools can take the ED demographic and do better than public schools, I’m all for it and would gladly let them get funding to do it.

    But most private schools don’t want this demographic either.

    And try getting some sort of comparable academic results wo we could actually verify they do better.

    This is a sill game where we’re we really won’t acknowledge what the real problems are but then also pretend that private/charter/non-public schools could do better.

    They probably cannot. ED kids are harder to teach and usually take more resources – i.e. highly skilled teachers – not nubies and not older ones who are not that good.

  12. LarrytheG Avatar

    It’s not rocket science. In any district where schools have high populations of ED , most teachers don’t want no part of it because it’s a losing proposition and the higher ups go looking for scapegoats when they get heat.

    Most teachers will find a school where that problem is not so bad.

    As far as I know, school districts cannot force teachers to teach at the “tough” schools – so they are forced to take whatever teachers they can find which are often newbies right out of college or older ones that other schools do not want.

    It’s a dirty little secret no one wants to talk about.

    In theory, every teacher is the “same” in terms of skill, qualifications, effectiveness, etc… districts are not allow to pay highly effective teachers “more” so they let them go to the school they want to teach at instead and most of them don’t want anything to do with teaching large classes of ED.

    I’ve said many times – that if private schools can take the ED demographic and do better than public schools, I’m all for it and would gladly let them get funding to do it.

    But most private schools don’t want this demographic either.

    And try getting some sort of comparable academic results wo we could actually verify they do better.

    This is a sill game where we’re we really won’t acknowledge what the real problems are but then also pretend that private/charter/non-public schools could do better.

    They probably cannot. ED kids are harder to teach and usually take more resources – i.e. highly skilled teachers – not nubies and not older ones who are not that good.

  13. Dick Hall-Sizemore Avatar
    Dick Hall-Sizemore

    Another devastating commentary on Richmond schools and another great job of digging out the data.

    Are the members of the city council and school board aware of this data? Of course, the school board members probably would prefer that it not be made widely known because it reflects on their failures as well.

    It would be interesting to know what localities are represented by the red triangles above the blue trend line in the reading chart. Those would be ones to emulate.

    1. LarrytheG Avatar

      In terms of Richmond’s problems.

      WHAT teacher WANTS to teach in Richmond schools to start with?

      It’s a huge volume of ED kids and really no rewards at being successful at it.

      Successful teachers find better schools to teach at. That’s the ugly reality.

      1. Dick Hall-Sizemore Avatar
        Dick Hall-Sizemore

        Larry, you are ignoring that there are lots of school divisions that have ED students whose pass rates are higher than Richmond. Even the “non ED” students in Richmond schools have lower pass rates than those in other divisions.

        What is not shown in Butcher’s data, by his own admission, is the relative number of ED to non-ED students in a division. That might make a difference.

        1. LarrytheG Avatar

          If you are a school teacher in the Richmond metro area and you had a job offer from Henrico and one from Richmond… or if you teach in Richmond and had an opportunity to teach in Chesterfield?

          The problems in Richmond ( and specific schools in other districts, including Henrico) are known to teachers and if they have choices as to where to teach, most of them are not going to go into the lions den of ED.

          Even districts outside of Richmond but with individual schools in their district with high numbers of ED, neighborhood schools in poverty neighborhoods – most teachers who have choices are going to take a job at a less problematical school if they can.

          That’s just the reality.

          Bucher keeps hammering on Richmond but he’s beating a dead horse! What can Richmond School administrators do? Can they offer higher salaries and guaranteed that teachers who end up with high ED will not be sanctioned if they do not produce good results?

          Teachers see this. They are human. Same pay, high chance of getting their career harmed – why would most?

          The urge for critics is to blame and heap abuse on the school leaders but even in that area – if you are a career administrator and you have a choice to work in Henrico or Chesterfield or Richmond – where would you choose?

          The big question, not addressed by the critics or Butcher is HOW to change this. What to do?

          It’ easy to keep piling blame on… but what does that solve?

    2. Dick,

      On the reading tests, the three divisions with ED pass rates above the Not ED fitted line are Highland, West Point, and Washington. As I pointed out in an earlier CIP post, Washington numbers in ’19 are funky. Highland is so small it’s hard to draw any conclusions. West Point is a consistent high performer.

      Taking a more relaxed measure, again on the reading tests, 19 divisions had ED pass rates more than 1 standard deviation (8.4) above the ED mean (66.6). Nine of those divisions are in Region 7 (Washington, Scott, Wise, Norton, Russell, Wythe, Tazewell, Dickenson, and Grayson).

      Shout if you’d like a copy of the spreadsheet.

      As to the ED population in Region 7, it was 61% in 2019. https://calaf.org/?p=7921

  14. Dick Hall-Sizemore Avatar
    Dick Hall-Sizemore

    Another devastating commentary on Richmond schools and another great job of digging out the data.

    Are the members of the city council and school board aware of this data? Of course, the school board members probably would prefer that it not be made widely known because it reflects on their failures as well.

    It would be interesting to know what localities are represented by the red triangles above the blue trend line in the reading chart. Those would be ones to emulate.

    1. LarrytheG Avatar

      In terms of Richmond’s problems.

      WHAT teacher WANTS to teach in Richmond schools to start with?

      It’s a huge volume of ED kids and really no rewards at being successful at it.

      Successful teachers find better schools to teach at. That’s the ugly reality.

      1. Dick Hall-Sizemore Avatar
        Dick Hall-Sizemore

        Larry, you are ignoring that there are lots of school divisions that have ED students whose pass rates are higher than Richmond. Even the “non ED” students in Richmond schools have lower pass rates than those in other divisions.

        What is not shown in Butcher’s data, by his own admission, is the relative number of ED to non-ED students in a division. That might make a difference.

        1. LarrytheG Avatar

          If you are a school teacher in the Richmond metro area and you had a job offer from Henrico and one from Richmond… or if you teach in Richmond and had an opportunity to teach in Chesterfield?

          The problems in Richmond ( and specific schools in other districts, including Henrico) are known to teachers and if they have choices as to where to teach, most of them are not going to go into the lions den of ED.

          Even districts outside of Richmond but with individual schools in their district with high numbers of ED, neighborhood schools in poverty neighborhoods – most teachers who have choices are going to take a job at a less problematical school if they can.

          That’s just the reality.

          Bucher keeps hammering on Richmond but he’s beating a dead horse! What can Richmond School administrators do? Can they offer higher salaries and guaranteed that teachers who end up with high ED will not be sanctioned if they do not produce good results?

          Teachers see this. They are human. Same pay, high chance of getting their career harmed – why would most?

          The urge for critics is to blame and heap abuse on the school leaders but even in that area – if you are a career administrator and you have a choice to work in Henrico or Chesterfield or Richmond – where would you choose?

          The big question, not addressed by the critics or Butcher is HOW to change this. What to do?

          It’ easy to keep piling blame on… but what does that solve?

    2. Dick,

      On the reading tests, the three divisions with ED pass rates above the Not ED fitted line are Highland, West Point, and Washington. As I pointed out in an earlier CIP post, Washington numbers in ’19 are funky. Highland is so small it’s hard to draw any conclusions. West Point is a consistent high performer.

      Taking a more relaxed measure, again on the reading tests, 19 divisions had ED pass rates more than 1 standard deviation (8.4) above the ED mean (66.6). Nine of those divisions are in Region 7 (Washington, Scott, Wise, Norton, Russell, Wythe, Tazewell, Dickenson, and Grayson).

      Shout if you’d like a copy of the spreadsheet.

      As to the ED population in Region 7, it was 61% in 2019. https://calaf.org/?p=7921

  15. Nancy_Naive Avatar
    Nancy_Naive

    Can’t wait for the 2020 census. Really curious about multigenerational households in the affluent neighborhoods. There are several 3 and a couple of 4-generation houses in a York County neighborhood with median homes of $3/4M. I wonder how that changes the “not ED”?

    https://www.pewresearch.org/fact-tank/2018/04/05/a-record-64-million-americans-live-in-multigenerational-households/

  16. Nancy_Naive Avatar
    Nancy_Naive

    Can’t wait for the 2020 census. Really curious about multigenerational households in the affluent neighborhoods. There are several 3 and a couple of 4-generation houses in a York County neighborhood with median homes of $3/4M. I wonder how that changes the “not ED”?

    https://www.pewresearch.org/fact-tank/2018/04/05/a-record-64-million-americans-live-in-multigenerational-households/

  17. LarrytheG Avatar

    Rural schools are different than more urban schools in several ways including how the economically disadvantaged are distributed geographically.

    In rural districts, the population is more homogenous. The rich, poor, in-between tend to be not clumped in economically stratified neighborhoods and schools tend to serve wider geographical areas.

    So the classes tend to be a mixure of the income/education demographics.

    In more urban areas, the neighborhoods tend to be more stratified geographically AND concentrated by income/education level. In other words, the better off tend to clump together in their neighborhoods and the lower income tend to clump together in their neighborhoods – and each neighborhood has a school that often relfects the demographics of the neighborhood.

    So, for instance, if you look at a District like Henrico – it has 72 elementary schools – look at the ED distribution and look at the SOL scores on a school by school basis.

    And what you will see is that some schools in Henrico are BETTER than the schools is Wise and SW Va and others are worse, much worse, some almost as bad as Richmond – the ones that geographically border Richmond.

    You don’t see this when you just compare school districts – some of which are rural and others suburban/urban.

    So tell me why the SOLs scores are so diverse in Henrico if it has the same school administrators and superintendent?

    Do we give credit to the school leaders for the high SOL scores in some of it’s schools and blame to the same administrators for schools that do poorly on SOLs?

    For the schools in Henrico that actually do BETTER than the schools in the CIP counties – do we attribute this to “better” teaching and for the ones that do worse, we say CIP is “Better”.

    See the point?

    Finally, the money part. It’s cost of living. Teachers simply get paid more in higher cost regions. They still have the same issues with ED kids.

    So, here’s a question. If Richmond and the low scoring schools in Henrico did what the CIP schools do – would it fix the issue?

    Is that what the CIP advocates are claiming?

    I wonder if Cranky might be willing to run the charts above – ONLY for Henrico – all 72 elementary schools? Easy enough to get the data, right?

  18. LarrytheG Avatar

    Rural schools are different than more urban schools in several ways including how the economically disadvantaged are distributed geographically.

    In rural districts, the population is more homogenous. The rich, poor, in-between tend to be not clumped in economically stratified neighborhoods and schools tend to serve wider geographical areas.

    So the classes tend to be a mixure of the income/education demographics.

    In more urban areas, the neighborhoods tend to be more stratified geographically AND concentrated by income/education level. In other words, the better off tend to clump together in their neighborhoods and the lower income tend to clump together in their neighborhoods – and each neighborhood has a school that often relfects the demographics of the neighborhood.

    So, for instance, if you look at a District like Henrico – it has 72 elementary schools – look at the ED distribution and look at the SOL scores on a school by school basis.

    And what you will see is that some schools in Henrico are BETTER than the schools is Wise and SW Va and others are worse, much worse, some almost as bad as Richmond – the ones that geographically border Richmond.

    You don’t see this when you just compare school districts – some of which are rural and others suburban/urban.

    So tell me why the SOLs scores are so diverse in Henrico if it has the same school administrators and superintendent?

    Do we give credit to the school leaders for the high SOL scores in some of it’s schools and blame to the same administrators for schools that do poorly on SOLs?

    For the schools in Henrico that actually do BETTER than the schools in the CIP counties – do we attribute this to “better” teaching and for the ones that do worse, we say CIP is “Better”.

    See the point?

    Finally, the money part. It’s cost of living. Teachers simply get paid more in higher cost regions. They still have the same issues with ED kids.

    So, here’s a question. If Richmond and the low scoring schools in Henrico did what the CIP schools do – would it fix the issue?

    Is that what the CIP advocates are claiming?

    I wonder if Cranky might be willing to run the charts above – ONLY for Henrico – all 72 elementary schools? Easy enough to get the data, right?

  19. James Wyatt Whitehead V Avatar
    James Wyatt Whitehead V

    The bullet list at the bottom of the article are very good. I see a fundamental shift in how and what is measured to achieve the appearance of desired results. Of course this will end up serving no one.

  20. James Wyatt Whitehead V Avatar
    James Wyatt Whitehead V

    The bullet list at the bottom of the article are very good. I see a fundamental shift in how and what is measured to achieve the appearance of desired results. Of course this will end up serving no one.

  21. Nancy_Naive Avatar
    Nancy_Naive

    Just out of curiosity, try normalizing to put the districts on more even footing. Try to change the x-axis from raw $-expenditure to the ratio of $-expenditure/median-income.

    It won’t change the two tiers of ED and NotED, but it will probably change the LMSE slopes.

  22. Nancy_Naive Avatar
    Nancy_Naive

    Just out of curiosity, try normalizing to put the districts on more even footing. Try to change the x-axis from raw $-expenditure to the ratio of $-expenditure/median-income.

    It won’t change the two tiers of ED and NotED, but it will probably change the LMSE slopes.

  23. LarrytheG Avatar

    That’s an interesting link.

    In theory, Virginia evens out the disparete income levels with the local composite index process that provides more state money to localties that have lower income levels.

    What we DON’T see is how much EACH school in a school district is funded and those numbers are driven largely by salaries which translates into how many staff, what level of education and length of time of service.

  24. LarrytheG Avatar

    That’s an interesting link.

    In theory, Virginia evens out the disparete income levels with the local composite index process that provides more state money to localties that have lower income levels.

    What we DON’T see is how much EACH school in a school district is funded and those numbers are driven largely by salaries which translates into how many staff, what level of education and length of time of service.

  25. […] earlier post showed the absence of a correlation between division day school expenditures and both the average […]

  26. Matt Hurt Avatar

    School divisions, like many other organizations, can only focus on a very few priorities and expect to make gains on those priorities. The more areas of focus, the fewer things can be accomplished. Besides student learning outcomes, divisions are already saddled with too many other priorities from the local, state, and federal levels.

    It seems that the Region VII schools do have an advantage in that the student body is more homogeneous- they trend towards the lower socioeconomic end of the spectrum. The problem with some of the more urban areas is that they have the extremes- very wealthy and very poor. I have yet to see a division that handles both ends of the spectrum equally well.

    Also, in Region VII, just about the only ballgame in town is the public school option. Since affluent parents in these metropolitan areas have plenty of options for their kids, these school divisions have to cater more to their affluent parents, because those parents have options in addition to the public schools. I assume the very poor families, in most instances, only have access to the public schools. If you compare the demographics of city residents and city school students, the two don’t normally line up, especially in the larger divisions. This creates an incentive for the division to provide more specific programming for the affluent students, while providing no incentive to better address their poor students.

    One of the biggest leadership problems I have witnessed in struggling school divisions is the top down leadership strategy of applying an algorithmic approach to school improvement. Those divisions that tend to be more successful seem to provide significant leadership opportunities at all levels of the organization, they tend to value and utilize the input of their people, and their people feel that their input really does matter. Granted, this is much more easily accomplished in smaller divisions.

    Teachers and principals in the struggling divisions feel much more frustrated in general, because of the lack of communication and the lack of trust in them evidenced by the division. I’m sure that this, among other things, exacerbates the employee retention problems in those divisions.

    1. LarrytheG Avatar

      Thank you. That was informative and useful in understanding more/better!

      I keep trying to get Cranky/Jim to show SOL scores for the elementary schools in Henrico (or Fairfax or other large system with diverse income demographics) – AND to comment on why the scores are so disparate if it is the same leaders and administrators.

      1. Matt Hurt Avatar

        Please see the comparisons between Henrico and Wise County. The scatterplots represent the relationship between the percentage of students in each school in those two divisions that are economically disadvantaged versus the SOL pass rates in reading and math. Each of the dots represents a different school in each of those divisions. What I see in this is that in Henrico, the less disadvantaged schools tend to have higher performance. In Wise County, the disadvantaged rates don’t vary nearly as much from school to school, but those differences don’t seem to make a difference in the SOL results. On top of all of that, Wise County was able to accomplish this with about $500 less per student in funding.

        https://www.baconsrebellion.com/app/uploads/2020/12/math-SOL.jpg

        https://www.baconsrebellion.com/app/uploads/2020/12/reading-SOL.jpg

        All of the data used to compile these scatterplots may be obtained at the website linked below.
        https://www.doe.virginia.gov/statistics_reports/index.shtml

        1. Fascinating data. What stands out to me is the fact that Wise County schools unanimously out-perform Henrico schools with the same percentage of disadvantaged students — the greater the percentage of disadvantaged students, the greater the out-performance.

          1. I know Wise County will eventually be getting Starlink satellite Internet, but in the meantime they will have great difficulty going virtual this spring.

            I live in a rural area and my wife teaches. Even many of the homes lucky enough to have Internet connections, don’t have sufficiently robust and reliable connections to easily accommodate virtual classrooms.

            I expect to see a downward spike for all K12 this year. The ones offering in-person instruction may not be as bad, but they will likely still trend down because not all parents are sending their children to school, even it it’s offered.

          2. LarrytheG Avatar

            And yet SOME schools in Henrico outperform Wise , correct?

            Yes, these charts ARE fascinating!

            Thanks, Matt!

        2. LarrytheG Avatar

          How much trouble to ADD the Richmond Schools to these graphs?

          😉

          1. Matt Hurt Avatar

            Not much at all. Those scatterplots have been updated in the link below. Notice how the trend for Henrico and Richmond City are very similar, while Wise is a significant outlier.

            https://docs.google.com/presentation/d/1SRSDhYURlGk4bn8HsmjnKyEQAlD8ZQY7ztWtHWwMpm8/edit?usp=sharing

          2. LarrytheG Avatar

            Matt. Thank You. This IS interesting!

            Clearly, Richmond has a few really bad schools even lower than Henrico – but Henrico itself has a number of lower schools also and Henrico is not a “poor” district financially and yet a wide diversity of scores in the same school district.

            Has been suggested and I agree, what would happen if Henrico AND Richmond adopted what CIP schools have done – in the lower SOL schools.

            Clearly, Henrico successfully teaches some kids in higher income areas to be among the highest scoring SOLs but I suspect all teachers in Henrico get paid the same no matter the school they teach in and probably higher salaries than CIP schools.

          3. Matt Hurt Avatar

            Here are the scatterplots for those who don’t wish to open the Google Slides presentation.

            https://www.baconsrebellion.com/app/uploads/2020/12/Reading-SO2.jpg

            https://www.baconsrebellion.com/app/uploads/2020/12/math-SOL2.jpg

          4. LarrytheG Avatar

            Pretty intersting scattershots. I’d be interested in hearing Jim and Crnanky’s takes.

            These scatters shots are SOL scores verses Percent of disadvantaged without regard to cost per student?

          5. Matt Hurt Avatar

            Correct Larry, just SOL performance relative to overall economically disadvantaged enrollments. In 2019, Henrico spent $10,440 per student, Richmond City $14,633 per student, and Wise spent $10,014 per student.

            In that year, the only divisions that spent less per student than Wise was Tazewell and Norton at $9,616 and $9,783 respectively. These two divisions also performed very well on their SOL results. All of this can be found in Table 15 at the link below.

            https://www.doe.virginia.gov/statistics_reports/supts_annual_report/2018-19/index.shtml

          6. LarrytheG Avatar

            I’m not sure the cost per student without accounting for cost-of-living is not a particularily useful measure. Rural teachers will invariably get paid less than urbanized teachers due to local costs and salaries endemic to that area.

            More than that – if you go to a place like Henrico where all the teachers are likely on the same pay scale, you will see significant variations in student performance on a per school-basis. Same teacher salaries at different schools and different academic performances. Can you really attribute money spent per student with academic performance as any kind of informative metric – same cost per student in all 72 elementary schools in Henrico – huge variation in academic performance.

          7. Nancy_Naive Avatar
            Nancy_Naive

            The only thing those plots say is that the kids in Wise are working like Hell to get outta there.

          8. Matt Hurt Avatar

            I wouldn’t say that the kids in Wise are working hard to get out of there, because Wise is all they know. They’re working hard because their teachers and administrators don’t give them another viable option. Kids are the same everywhere, they pretty much do the least they’re allowed. It seems that most kids have more pressing concerns than school work.

          9. Matt Hurt Avatar

            The long and the short of it is that if some little back water, Podunk place like Wise can figure out how to make sure more of their kids meet the minimum state expectation, why can’t everyone? I can only assume that other places don’t have the faith that their kids can learn to that level, don’t have the faith that their educators can get it done, or possibly don’t have their priorities in order to accomplish this. This ain’t rocket science!

          10. LarrytheG Avatar

            Not rocket science, but the academic gap between economically disadvantaged and not is there in most school systems across the state and most other states.

            In a not-rural place like Henrico with 80-some elementary schools, those schools reflect the income demographics of the neighborhoods they draw from whereas Wise and other rural tend to draw from much wider geography.

            Both have economically disadvantaged but are rural economically disadvantaged the same or similar to urban econoically disadvantaged?

            For instance, much discussion about single-parent familes in urban economically disadvantaged households. Same hold true for rural?

          11. Matt Hurt Avatar

            Yes sir, the stable two parent household in Wise is a problem, and is much more so with folks who live below the poverty line. Since Uncle Sam provides for these single parent mothers, there’s not much incentive for intact families, and our kids and society in general suffer the consequences. Right, wrong, or indifferent, that’s the way it is. I don’t think urban centers have the market cornered on this sad fact.

            For educators, I really think it boils down to the choice of whether to make excuses why it can’t be done or to ensure these kids achieve. It’s hard to do both at the same time. By the way, it is much easier to make excuses.

          12. LarrytheG Avatar

            How about race? I get the impression there are few blacks in these rural SW Va counties?

            But you’re saying one-parent famlies still a significant characteristic of rural econonmically disadvantaged?

            I strongly suspect there are greater numbers of ED blacks in rural Southside Va.

          13. Matt Hurt Avatar

            Larry- yes sir, single parent families are a big problem in Region VII, coupled with the problems of grandparents and great-grandparents rearing kids. When discussing the grandparent issue, it’s important to note that in many cases, the person who is rearing the grandchildren also reared the parent of those grandchildren, so one typically expect the same kinds of outcomes for those grandchildren, which is very sad.

            https://docs.google.com/presentation/d/1INtM_jl4Ih2odq7jbS0iBB146E6AjGScgcihOWpQ8Y0/edit?usp=sharing

            I’ve shared this before- slide #2 displays the demographic information by region. It is important to understand that the Economically Disadvantaged numbers are a bit skewed for two reasons.

            First, the state implemented the Community Eligibility Program a few years ago, and each year, more divisions have taken advantage of that. The CEP allows divisions to provide free meals to every student in a school if the school has a high enough threshold of students who automatically received free meals (those students who receive TANF, etc.). Therefore, students who used to bring in a free lunch form who are not direct certified no longer have to, and those students are no longer considered Economically Disadvantaged.

            Another factor significantly skewed Region VIII’s Economically Disadvantaged numbers in 2019. One of the divisions implemented the CEP division wide, and in their state reports counted every student as Economically Disadvantaged erroneously. This skewed Region VIII’s numbers significantly.

            Because of these two factors, the poverty statistics that we get from the Census Bureau is typically more consistent and may be a better indicator of students who live on the other side of the tracks than the Economically Disadvantaged statistic.

            Yes, Region VIII has many more black students than Region VII. However, Region VII’s black students are among the highest performing in the state (slides 31-33). Again, folks can make excuses or they can make good things happen for their students, but not both.

            On this note, years ago, I worked for an urban, minority majority school division. One of the priorities of the division was to ensure that more black students took advantage of a free local community college program. The big problem was that many of these students had difficulty passing the placement exam. The leadership in that division focused all of the efforts to fix this in the high schools, and completely neglected the fact that black students in that division had atrocious rates of proficiency in reading and math at the elementary levels. I liken the efforts at the high school to fix that problem to shutting the barn door after the mule had already gotten out. The real solution was to make sure those students were proficient in those basic skills beginning in Kindergarten and going through the other grades.

            If you look in those schools that have high black or high economically disadvantaged enrollments and low SOL performance, you will find a huge discrepancy between grades and SOL results. They will not have nearly as many failures on their report cards as they do on the SOL test. They will have significant numbers of students who are awarded an A for the class to fail their SOL test. All of this is an example of the lower expectations to which those students are held. In the schools where their black and economically disadvantaged students are doing significantly better, you’ll find significantly better relationships between their grades and SOL outcomes (e.i higher expectations for those students). All this is as sure as God made little green apples, and you can take that to the bank!

            As you can tell, I’m a little bit passionate about this subject. If someone has a better path forward, I’m all ears. However, no one has been able to provide a better answer, and I work with tons of folks on this.

  27. Matt Hurt Avatar

    School divisions, like many other organizations, can only focus on a very few priorities and expect to make gains on those priorities. The more areas of focus, the fewer things can be accomplished. Besides student learning outcomes, divisions are already saddled with too many other priorities from the local, state, and federal levels.

    It seems that the Region VII schools do have an advantage in that the student body is more homogeneous- they trend towards the lower socioeconomic end of the spectrum. The problem with some of the more urban areas is that they have the extremes- very wealthy and very poor. I have yet to see a division that handles both ends of the spectrum equally well.

    Also, in Region VII, just about the only ballgame in town is the public school option. Since affluent parents in these metropolitan areas have plenty of options for their kids, these school divisions have to cater more to their affluent parents, because those parents have options in addition to the public schools. I assume the very poor families, in most instances, only have access to the public schools. If you compare the demographics of city residents and city school students, the two don’t normally line up, especially in the larger divisions. This creates an incentive for the division to provide more specific programming for the affluent students, while providing no incentive to better address their poor students.

    One of the biggest leadership problems I have witnessed in struggling school divisions is the top down leadership strategy of applying an algorithmic approach to school improvement. Those divisions that tend to be more successful seem to provide significant leadership opportunities at all levels of the organization, they tend to value and utilize the input of their people, and their people feel that their input really does matter. Granted, this is much more easily accomplished in smaller divisions.

    Teachers and principals in the struggling divisions feel much more frustrated in general, because of the lack of communication and the lack of trust in them evidenced by the division. I’m sure that this, among other things, exacerbates the employee retention problems in those divisions.

    1. LarrytheG Avatar

      Thank you. That was informative and useful in understanding more/better!

      I keep trying to get Cranky/Jim to show SOL scores for the elementary schools in Henrico (or Fairfax or other large system with diverse income demographics) – AND to comment on why the scores are so disparate if it is the same leaders and administrators.

      1. Matt Hurt Avatar

        Please see the comparisons between Henrico and Wise County. The scatterplots represent the relationship between the percentage of students in each school in those two divisions that are economically disadvantaged versus the SOL pass rates in reading and math. Each of the dots represents a different school in each of those divisions. What I see in this is that in Henrico, the less disadvantaged schools tend to have higher performance. In Wise County, the disadvantaged rates don’t vary nearly as much from school to school, but those differences don’t seem to make a difference in the SOL results. On top of all of that, Wise County was able to accomplish this with about $500 less per student in funding.

        https://www.baconsrebellion.com/app/uploads/2020/12/math-SOL.jpg

        https://www.baconsrebellion.com/app/uploads/2020/12/reading-SOL.jpg

        All of the data used to compile these scatterplots may be obtained at the website linked below.
        https://www.doe.virginia.gov/statistics_reports/index.shtml

        1. LarrytheG Avatar

          How much trouble to ADD the Richmond Schools to these graphs?

          😉

          1. Matt Hurt Avatar

            Not much at all. Those scatterplots have been updated in the link below. Notice how the trend for Henrico and Richmond City are very similar, while Wise is a significant outlier.

            https://docs.google.com/presentation/d/1SRSDhYURlGk4bn8HsmjnKyEQAlD8ZQY7ztWtHWwMpm8/edit?usp=sharing

          2. LarrytheG Avatar

            Matt. Thank You. This IS interesting!

            Clearly, Richmond has a few really bad schools even lower than Henrico – but Henrico itself has a number of lower schools also and Henrico is not a “poor” district financially and yet a wide diversity of scores in the same school district.

            Has been suggested and I agree, what would happen if Henrico AND Richmond adopted what CIP schools have done – in the lower SOL schools.

            Clearly, Henrico successfully teaches some kids in higher income areas to be among the highest scoring SOLs but I suspect all teachers in Henrico get paid the same no matter the school they teach in and probably higher salaries than CIP schools.

          3. Matt Hurt Avatar

            Here are the scatterplots for those who don’t wish to open the Google Slides presentation.

            https://www.baconsrebellion.com/app/uploads/2020/12/Reading-SO2.jpg

            https://www.baconsrebellion.com/app/uploads/2020/12/math-SOL2.jpg

          4. LarrytheG Avatar

            Pretty intersting scattershots. I’d be interested in hearing Jim and Crnanky’s takes.

            These scatters shots are SOL scores verses Percent of disadvantaged without regard to cost per student?

          5. Matt Hurt Avatar

            Correct Larry, just SOL performance relative to overall economically disadvantaged enrollments. In 2019, Henrico spent $10,440 per student, Richmond City $14,633 per student, and Wise spent $10,014 per student.

            In that year, the only divisions that spent less per student than Wise was Tazewell and Norton at $9,616 and $9,783 respectively. These two divisions also performed very well on their SOL results. All of this can be found in Table 15 at the link below.

            https://www.doe.virginia.gov/statistics_reports/supts_annual_report/2018-19/index.shtml

          6. Matt Hurt Avatar

            The long and the short of it is that if some little back water, Podunk place like Wise can figure out how to make sure more of their kids meet the minimum state expectation, why can’t everyone? I can only assume that other places don’t have the faith that their kids can learn to that level, don’t have the faith that their educators can get it done, or possibly don’t have their priorities in order to accomplish this. This ain’t rocket science!

          7. LarrytheG Avatar

            I’m not sure the cost per student without accounting for cost-of-living is not a particularily useful measure. Rural teachers will invariably get paid less than urbanized teachers due to local costs and salaries endemic to that area.

            More than that – if you go to a place like Henrico where all the teachers are likely on the same pay scale, you will see significant variations in student performance on a per school-basis. Same teacher salaries at different schools and different academic performances. Can you really attribute money spent per student with academic performance as any kind of informative metric – same cost per student in all 72 elementary schools in Henrico – huge variation in academic performance.

          8. Nancy_Naive Avatar
            Nancy_Naive

            The only thing those plots say is that the kids in Wise are working like Hell to get outta there.

          9. Matt Hurt Avatar

            I wouldn’t say that the kids in Wise are working hard to get out of there, because Wise is all they know. They’re working hard because their teachers and administrators don’t give them another viable option. Kids are the same everywhere, they pretty much do the least they’re allowed. It seems that most kids have more pressing concerns than school work.

          10. LarrytheG Avatar

            Not rocket science, but the academic gap between economically disadvantaged and not is there in most school systems across the state and most other states.

            In a not-rural place like Henrico with 80-some elementary schools, those schools reflect the income demographics of the neighborhoods they draw from whereas Wise and other rural tend to draw from much wider geography.

            Both have economically disadvantaged but are rural economically disadvantaged the same or similar to urban econoically disadvantaged?

            For instance, much discussion about single-parent familes in urban economically disadvantaged households. Same hold true for rural?

          11. Matt Hurt Avatar

            Yes sir, the stable two parent household in Wise is a problem, and is much more so with folks who live below the poverty line. Since Uncle Sam provides for these single parent mothers, there’s not much incentive for intact families, and our kids and society in general suffer the consequences. Right, wrong, or indifferent, that’s the way it is. I don’t think urban centers have the market cornered on this sad fact.

            For educators, I really think it boils down to the choice of whether to make excuses why it can’t be done or to ensure these kids achieve. It’s hard to do both at the same time. By the way, it is much easier to make excuses.

          12. LarrytheG Avatar

            How about race? I get the impression there are few blacks in these rural SW Va counties?

            But you’re saying one-parent famlies still a significant characteristic of rural econonmically disadvantaged?

            I strongly suspect there are greater numbers of ED blacks in rural Southside Va.

          13. Matt Hurt Avatar

            Larry- yes sir, single parent families are a big problem in Region VII, coupled with the problems of grandparents and great-grandparents rearing kids. When discussing the grandparent issue, it’s important to note that in many cases, the person who is rearing the grandchildren also reared the parent of those grandchildren, so one typically expect the same kinds of outcomes for those grandchildren, which is very sad.

            https://docs.google.com/presentation/d/1INtM_jl4Ih2odq7jbS0iBB146E6AjGScgcihOWpQ8Y0/edit?usp=sharing

            I’ve shared this before- slide #2 displays the demographic information by region. It is important to understand that the Economically Disadvantaged numbers are a bit skewed for two reasons.

            First, the state implemented the Community Eligibility Program a few years ago, and each year, more divisions have taken advantage of that. The CEP allows divisions to provide free meals to every student in a school if the school has a high enough threshold of students who automatically received free meals (those students who receive TANF, etc.). Therefore, students who used to bring in a free lunch form who are not direct certified no longer have to, and those students are no longer considered Economically Disadvantaged.

            Another factor significantly skewed Region VIII’s Economically Disadvantaged numbers in 2019. One of the divisions implemented the CEP division wide, and in their state reports counted every student as Economically Disadvantaged erroneously. This skewed Region VIII’s numbers significantly.

            Because of these two factors, the poverty statistics that we get from the Census Bureau is typically more consistent and may be a better indicator of students who live on the other side of the tracks than the Economically Disadvantaged statistic.

            Yes, Region VIII has many more black students than Region VII. However, Region VII’s black students are among the highest performing in the state (slides 31-33). Again, folks can make excuses or they can make good things happen for their students, but not both.

            On this note, years ago, I worked for an urban, minority majority school division. One of the priorities of the division was to ensure that more black students took advantage of a free local community college program. The big problem was that many of these students had difficulty passing the placement exam. The leadership in that division focused all of the efforts to fix this in the high schools, and completely neglected the fact that black students in that division had atrocious rates of proficiency in reading and math at the elementary levels. I liken the efforts at the high school to fix that problem to shutting the barn door after the mule had already gotten out. The real solution was to make sure those students were proficient in those basic skills beginning in Kindergarten and going through the other grades.

            If you look in those schools that have high black or high economically disadvantaged enrollments and low SOL performance, you will find a huge discrepancy between grades and SOL results. They will not have nearly as many failures on their report cards as they do on the SOL test. They will have significant numbers of students who are awarded an A for the class to fail their SOL test. All of this is an example of the lower expectations to which those students are held. In the schools where their black and economically disadvantaged students are doing significantly better, you’ll find significantly better relationships between their grades and SOL outcomes (e.i higher expectations for those students). All this is as sure as God made little green apples, and you can take that to the bank!

            As you can tell, I’m a little bit passionate about this subject. If someone has a better path forward, I’m all ears. However, no one has been able to provide a better answer, and I work with tons of folks on this.

        2. Fascinating data. What stands out to me is the fact that Wise County schools unanimously out-perform Henrico schools with the same percentage of disadvantaged students — the greater the percentage of disadvantaged students, the greater the out-performance.

          1. I know Wise County will eventually be getting Starlink satellite Internet, but in the meantime they will have great difficulty going virtual this spring.

            I live in a rural area and my wife teaches. Even many of the homes lucky enough to have Internet connections, don’t have sufficiently robust and reliable connections to easily accommodate virtual classrooms.

            I expect to see a downward spike for all K12 this year. The ones offering in-person instruction may not be as bad, but they will likely still trend down because not all parents are sending their children to school, even it it’s offered.

          2. LarrytheG Avatar

            And yet SOME schools in Henrico outperform Wise , correct?

            Yes, these charts ARE fascinating!

            Thanks, Matt!

  28. Reed Fawell 3rd Avatar
    Reed Fawell 3rd

    I missed this post on its first publishing. Not only is it excellent in methodology and presentation, it is wonderful in its results and implied conclusions. I read it to support the general take aways from the obvious and plain to see results of the Success Academy, namely that achievement gaps between disadvantaged kids and non disadvantaged kids are overwhelmingly the result of culture gaps at home and at schools where these kids live and work. (This also affirms the work of Thomas Sowell, and Hirsch.) Thus, if we fix those culture gaps in key and highly definable ways that directly impact the kids at issue, then for those kids the achievement gaps can be quickly and substantially closed. And often erased altogether. Even to the point of the disadvantaged kids then are regularly achieving substantially above level of advantaged kids, as often happens at Success Academy schools. My sense is that more and more people are seeing this reality and its potential. And that now we plainly have the power, and are gaining the will, to begin seriously erasing those gaps.

    Indeed, now apparently, we have made more of such progress to date than heretofore was not fully realized or appreciated, if only because it has been under reported.

  29. Reed Fawell 3rd Avatar
    Reed Fawell 3rd

    I missed this post on its first publishing. Not only is it excellent in methodology and presentation, it is wonderful in its results and implied conclusions. I read it to support the general take aways from the obvious and plain to see results of the Success Academy, namely that achievement gaps between disadvantaged kids and non disadvantaged kids are overwhelmingly the result of culture gaps at home and at schools where these kids live and work. (This also affirms the work of Thomas Sowell, and Hirsch.) Thus, if we fix those culture gaps in key and highly definable ways that directly impact the kids at issue, then for those kids the achievement gaps can be quickly and substantially closed. And often erased altogether. Even to the point of the disadvantaged kids then are regularly achieving substantially above level of advantaged kids, as often happens at Success Academy schools. My sense is that more and more people are seeing this reality and its potential. And that now we plainly have the power, and are gaining the will, to begin seriously erasing those gaps.

    Indeed, now apparently, we have made more of such progress to date than heretofore was not fully realized or appreciated, if only because it has been under reported.

  30. Reed Fawell 3rd Avatar
    Reed Fawell 3rd

    As regards value of Culture (not race) for learning consider this extract from Quillette article “A Peculiar Kind of Racist Patriarchy,” by Rav Arova:

    “Asian success in the West has long been disputed as an example of the “model minority myth” that critics say is used to downplay the impact of societal racism. Asian immigrants, they argue, come from the highly educated upper echelons of their home countries, which gives them an advantage over native-born citizens. But this claim is self-refuting—it admits that “human capital” (familial values, vocational skills, work ethic, conducive cultural patterns) supersedes perceived discrimination and the impact of any systemic or institutional racism. Immigrants who arrive in a new land to which they are not acculturated, but whose intelligence and cultural habits allow them to outperform native whites over time, repudiate a progressive narrative that insists race and not merit determines success.

    While immigration selectivity does factor into relative Asian success, it only accounts for part of the reason certain Asian groups have excelled in the West—immigrant groups are not uniformly educated or economically well-off. For example, about 50 percent of Chinese, Pakistani, Indonesian, Korean, and Filipino immigrants have a bachelor’s degree or higher. But the same is true of only a quarter of Vietnamese immigrants—fewer than white Americans (35 percent in 2016). Syrian immigrants have roughly the same level of education as white Americans, yet Syrian Americans and the rest of these aforementioned groups out-earn whites according to the latest data. This is despite the fact that language barriers disadvantage immigrants relative to native-born Americans. Only 34 percent of Vietnamese immigrants and 51 percent of Japanese immigrants (to take two examples) are proficient in English (compared with virtually all of white Americans), yet they still have higher household median incomes than whites by about $2,000 and $15,000, respectively. The idea that all—or most—immigrants are preconditioned for success is a myth. Selectivity is only one part of the puzzle.

    Some immigrant groups with high rates of poverty defy the odds and flourish in the US. For example, the children of immigrants from Southeast Asian countries such as Cambodia, Vietnam, and Laos routinely attain high levels of academic achievement despite their low socioeconomic status compared to whites. In their paper, “Culture and Asian-White Achievement Difference,” University of Michigan sociologists Airan Liu and Yu Xie offer a meta-analysis of the available literature on Asian academic achievement. They find that:

    Qualitative research indicates that even Asian American children from disadvantaged family backgrounds enjoy the Asian premium in academic achievement (e.g., Lee and Zhou, 2014), which suggests that access to more and better home resources is not the key to their success.

    Several studies that control for self-selecting factors still find that several Asian groups out-perform whites in the economic domain. The most pronounced disparities are among women. In a comprehensive 2019 study conducted in Canada, researchers controlled for age, marital status, education level, and native language to compare yearly incomes between second generation ethnic groups with white Canadians. Interestingly, no second generation male ethnic group out-earned third-plus generation whites (without controlling for the aforementioned variables, South Asian, Japanese, Korean, and Chinese men out-earned third-plus generation whites). The outcomes among women, however, were very different. South Asian, Chinese, Southeast Asian, and Korean immigrant women all out-earned third-plus generation white women. The intersectional claim of overlapping oppression again fails because ethnic women perform relatively better than ethnic men compared to their gendered counterparts.

    Asian women’s extraordinarily high earnings can be explained by several recorded cultural patterns. They have the highest education levels of all major groups. They are also most likely to major in the most high-paying fields in college (primarily STEM) compared to other female groups. Asian women’s familial choices also strongly correlate with their success in the labour market. According to the CDC (table 11), Asian mothers are least likely to have children out of wedlock. Only 11.7 percent of Asian children are born out of wedlock, compared to 28.2 percent of whites, 51.8 percent of Hispanics, and 69.4 percent of blacks (it is worth noting, incidentally, that the black illegitimacy rate in 1940 was lower than the white illegitimacy rate today). Moreover, the average age of an Asian mother at the time she gives birth to her first child is just over 30. Comparatively, the average age is 28 for whites and 25 for Hispanics and blacks. Asians also have lower birth rates than blacks and Hispanics (but not whites) and the lowest divorce rate. Japanese, Korean, and Chinese women specifically have lower birth rates than all major racial groups [figure 2 in the linked paper]. And as sociologists Arthur Sakamoto and Sharron Xuanren Wang point out in their new paper, Asian children benefit from familial support:

    In addition to being more likely to have their own two biological parents, Asian American children benefit from being more likely to have the supplementary adult supervision of grandparents in their home (Raley et al., 2019), who help to provide quality childcare as well as to instill more traditional Asian values (Tam and Detzner, 1998).

    Stating these facts has become controversial due to fears of stereotyping and stigmatizing members of under-performing groups. But regardless of one’s personal views on illegitimacy, marriage, and parenthood, Asian women’s cultural habits on average—majoring in more high-paying fields, rarely having kids out of wedlock, and having fewer kids and more familial support raising them—do correlate with better outcomes: more stable families, financial security, and time devoted to pursuing a career.

    But this has become a taboo realm of analysis in a culture preoccupied with society’s structural dynamics because it implicates personal choices and cultural norms in the determination of life outcomes. As Malcolm Gladwell advises in his book Outliers, behavioral traits common in Asian cultures shouldn’t be dismissed—we should learn from them. On average, Asians spend the most amount of time doing homework and the least amount of time watching television compared to other racial groups. Asians are more likely to believe in the idea of self-made success than other major racial groups—a survey by the Pew Research Center found that 69 percent of Asian Americans, compared with 58 percent of the general public, think that “most people who want to get ahead can make it if they are willing to work hard.” In their paper, “Explaining Asian Americans’ Academic Advantage over Whites,” researchers from the University of Michigan and the City University of New York examine Asian Americans’ superior academic achievement. They find that Asian Americans are more likely to believe that self-effort, rather than natural ability, is the main determinant of academic achievement:

    These differences matter because students who consider effort important demonstrate greater intrinsic interest in academic tasks and are more likely to interpret challenges as cues to increase effort. The belief that achievement is not predestined but is the result of hard work may motivate Asian-American parents to set high educational expectations for their children.

    Their study also finds that “socio-demographic differences explain almost none of the overall Asia-white gap in academic effort,” which means that factors such as household income, marital status, employment, and location have little-to-no bearing on the amount of effort Asian students invest in their education. Interestingly, their study finds South Asian parents have the highest expectations relative to whites (Indian Americans are the highest-earning group in America while Pakistani Americans are fifth). The researchers conclude: “Asian American youth’s advantage in education can be attributed mainly to their work ethic, whether real or perceived, rather than to advantages in cognitive skills or socioeconomic status.”

    The cultural phenomenon of Asian overachievement isn’t conditional on genes, intelligence or socioeconomic status. In a study entitled “Race and Economic Opportunity in the United States: an Intergenerational Perspective” led by Raj Chetty from Harvard, the authors found that over 26 percent of Asian children born to parents in the lowest income quintile earn incomes in the highest income quintile compared to 11 percent of whites, seven percent of Hispanics, and three percent of blacks.

    It’s no surprise that Asians have the highest economic mobility in America given their shrewd financial sensibilities on average. As Coleman Hughes has pointed out, Asians scored highest in a financial health scorecard (measuring “whether a family is making sound, everyday-financial decisions”) developed by researchers at the Federal Reserve Bank of St. Louis in 2015. Eliminating the confounds of age and education level, their paper finds middle-aged Asian family heads with advanced degrees scored substantially higher on financial health relative to their comparable Hispanic, black, and white counterparts. As such, the authors conclude that “differences in the age composition and in the level of educational attainment across groups explain relatively little of the gaps.” It is culture—at least in significant part—that differentiates why some groups out-perform others …”

    For more see: https://quillette.com/2020/12/22/a-peculiar-kind-of-racist-patriarchy/

  31. Reed Fawell 3rd Avatar
    Reed Fawell 3rd

    As regards value of Culture (not race) for learning consider this extract from Quillette article “A Peculiar Kind of Racist Patriarchy,” by Rav Arova:

    “Asian success in the West has long been disputed as an example of the “model minority myth” that critics say is used to downplay the impact of societal racism. Asian immigrants, they argue, come from the highly educated upper echelons of their home countries, which gives them an advantage over native-born citizens. But this claim is self-refuting—it admits that “human capital” (familial values, vocational skills, work ethic, conducive cultural patterns) supersedes perceived discrimination and the impact of any systemic or institutional racism. Immigrants who arrive in a new land to which they are not acculturated, but whose intelligence and cultural habits allow them to outperform native whites over time, repudiate a progressive narrative that insists race and not merit determines success.

    While immigration selectivity does factor into relative Asian success, it only accounts for part of the reason certain Asian groups have excelled in the West—immigrant groups are not uniformly educated or economically well-off. For example, about 50 percent of Chinese, Pakistani, Indonesian, Korean, and Filipino immigrants have a bachelor’s degree or higher. But the same is true of only a quarter of Vietnamese immigrants—fewer than white Americans (35 percent in 2016). Syrian immigrants have roughly the same level of education as white Americans, yet Syrian Americans and the rest of these aforementioned groups out-earn whites according to the latest data. This is despite the fact that language barriers disadvantage immigrants relative to native-born Americans. Only 34 percent of Vietnamese immigrants and 51 percent of Japanese immigrants (to take two examples) are proficient in English (compared with virtually all of white Americans), yet they still have higher household median incomes than whites by about $2,000 and $15,000, respectively. The idea that all—or most—immigrants are preconditioned for success is a myth. Selectivity is only one part of the puzzle.

    Some immigrant groups with high rates of poverty defy the odds and flourish in the US. For example, the children of immigrants from Southeast Asian countries such as Cambodia, Vietnam, and Laos routinely attain high levels of academic achievement despite their low socioeconomic status compared to whites. In their paper, “Culture and Asian-White Achievement Difference,” University of Michigan sociologists Airan Liu and Yu Xie offer a meta-analysis of the available literature on Asian academic achievement. They find that:

    Qualitative research indicates that even Asian American children from disadvantaged family backgrounds enjoy the Asian premium in academic achievement (e.g., Lee and Zhou, 2014), which suggests that access to more and better home resources is not the key to their success.

    Several studies that control for self-selecting factors still find that several Asian groups out-perform whites in the economic domain. The most pronounced disparities are among women. In a comprehensive 2019 study conducted in Canada, researchers controlled for age, marital status, education level, and native language to compare yearly incomes between second generation ethnic groups with white Canadians. Interestingly, no second generation male ethnic group out-earned third-plus generation whites (without controlling for the aforementioned variables, South Asian, Japanese, Korean, and Chinese men out-earned third-plus generation whites). The outcomes among women, however, were very different. South Asian, Chinese, Southeast Asian, and Korean immigrant women all out-earned third-plus generation white women. The intersectional claim of overlapping oppression again fails because ethnic women perform relatively better than ethnic men compared to their gendered counterparts.

    Asian women’s extraordinarily high earnings can be explained by several recorded cultural patterns. They have the highest education levels of all major groups. They are also most likely to major in the most high-paying fields in college (primarily STEM) compared to other female groups. Asian women’s familial choices also strongly correlate with their success in the labour market. According to the CDC (table 11), Asian mothers are least likely to have children out of wedlock. Only 11.7 percent of Asian children are born out of wedlock, compared to 28.2 percent of whites, 51.8 percent of Hispanics, and 69.4 percent of blacks (it is worth noting, incidentally, that the black illegitimacy rate in 1940 was lower than the white illegitimacy rate today). Moreover, the average age of an Asian mother at the time she gives birth to her first child is just over 30. Comparatively, the average age is 28 for whites and 25 for Hispanics and blacks. Asians also have lower birth rates than blacks and Hispanics (but not whites) and the lowest divorce rate. Japanese, Korean, and Chinese women specifically have lower birth rates than all major racial groups [figure 2 in the linked paper]. And as sociologists Arthur Sakamoto and Sharron Xuanren Wang point out in their new paper, Asian children benefit from familial support:

    In addition to being more likely to have their own two biological parents, Asian American children benefit from being more likely to have the supplementary adult supervision of grandparents in their home (Raley et al., 2019), who help to provide quality childcare as well as to instill more traditional Asian values (Tam and Detzner, 1998).

    Stating these facts has become controversial due to fears of stereotyping and stigmatizing members of under-performing groups. But regardless of one’s personal views on illegitimacy, marriage, and parenthood, Asian women’s cultural habits on average—majoring in more high-paying fields, rarely having kids out of wedlock, and having fewer kids and more familial support raising them—do correlate with better outcomes: more stable families, financial security, and time devoted to pursuing a career.

    But this has become a taboo realm of analysis in a culture preoccupied with society’s structural dynamics because it implicates personal choices and cultural norms in the determination of life outcomes. As Malcolm Gladwell advises in his book Outliers, behavioral traits common in Asian cultures shouldn’t be dismissed—we should learn from them. On average, Asians spend the most amount of time doing homework and the least amount of time watching television compared to other racial groups. Asians are more likely to believe in the idea of self-made success than other major racial groups—a survey by the Pew Research Center found that 69 percent of Asian Americans, compared with 58 percent of the general public, think that “most people who want to get ahead can make it if they are willing to work hard.” In their paper, “Explaining Asian Americans’ Academic Advantage over Whites,” researchers from the University of Michigan and the City University of New York examine Asian Americans’ superior academic achievement. They find that Asian Americans are more likely to believe that self-effort, rather than natural ability, is the main determinant of academic achievement:

    These differences matter because students who consider effort important demonstrate greater intrinsic interest in academic tasks and are more likely to interpret challenges as cues to increase effort. The belief that achievement is not predestined but is the result of hard work may motivate Asian-American parents to set high educational expectations for their children.

    Their study also finds that “socio-demographic differences explain almost none of the overall Asia-white gap in academic effort,” which means that factors such as household income, marital status, employment, and location have little-to-no bearing on the amount of effort Asian students invest in their education. Interestingly, their study finds South Asian parents have the highest expectations relative to whites (Indian Americans are the highest-earning group in America while Pakistani Americans are fifth). The researchers conclude: “Asian American youth’s advantage in education can be attributed mainly to their work ethic, whether real or perceived, rather than to advantages in cognitive skills or socioeconomic status.”

    The cultural phenomenon of Asian overachievement isn’t conditional on genes, intelligence or socioeconomic status. In a study entitled “Race and Economic Opportunity in the United States: an Intergenerational Perspective” led by Raj Chetty from Harvard, the authors found that over 26 percent of Asian children born to parents in the lowest income quintile earn incomes in the highest income quintile compared to 11 percent of whites, seven percent of Hispanics, and three percent of blacks.

    It’s no surprise that Asians have the highest economic mobility in America given their shrewd financial sensibilities on average. As Coleman Hughes has pointed out, Asians scored highest in a financial health scorecard (measuring “whether a family is making sound, everyday-financial decisions”) developed by researchers at the Federal Reserve Bank of St. Louis in 2015. Eliminating the confounds of age and education level, their paper finds middle-aged Asian family heads with advanced degrees scored substantially higher on financial health relative to their comparable Hispanic, black, and white counterparts. As such, the authors conclude that “differences in the age composition and in the level of educational attainment across groups explain relatively little of the gaps.” It is culture—at least in significant part—that differentiates why some groups out-perform others …”

    For more see: https://quillette.com/2020/12/22/a-peculiar-kind-of-racist-patriarchy/

  32. LarrytheG Avatar

    Gonna add this – you probably know these but some won’t:

    https://vaspa.net/images/va_region_map.jpg

    Interesting that CIP does not seem to include all of region 7 and IS in some others in Region 3?

    1. Matt Hurt Avatar

      All of Region VII is in the CIP.

  33. LarrytheG Avatar

    My mistake….

    I think you did have a slide that showed Region VII SOL performance before CIP was instituted – and after?

    1. Matt Hurt Avatar

      Slides 20-34 display the regional pass rates from 2006 to 2019. The first implementation year of the CIP was 2016.

  34. LarrytheG Avatar

    Still working my way through the slides – lots to see and try to understand.

    First question: Why does Southside spend near the top on a per student basis, highest staffing levels but has among the lowest teacher pay?

    What does that mean?

    1. Matt Hurt Avatar

      When you begin to consider public school funding, you quickly go down a rabbit hole that has many tunnels and chambers. The LCI is a means by which the state tries to provide equity for public education, but it does not accomplish this very well. Then, you have the local funding. Some localities value public education more as measured by the fact that they allocate a greater fraction of the county/city budget to public education, and others value it less so. After that, it comes to the local school board that is tasked with allocating the funds to the different priorities within the division.

      Region VIII has the second smallest average school enrollment and the second smallest average division enrollment. Despite how many students are enrolled, each division and school is required to accomplish those tasks mandated by federal and state laws and regulations. Larger institutions can take advantage of economies of scale to get these things done more efficiently. Just because a division or school is small, they don’t get a deferment on meeting these requirements, and thus it typically costs more on a per student basis.

      As far as staffing goes, a larger school can operate more efficiently than a smaller school. Take for advantage state class size requirements. There are certain factors that dictate minimum class sizes at the elementary level, but for the sake of this discussion, let’s say that we have to maintain no more than 24 students per teacher. A small school may have 25 students in a grade, and they must employ two teachers in that grade to meet the requirement. A larger school may have 90 students, and they have to employ 4 teachers. Given the same cost per teacher (let’s use $60,000 as a rough estimate), it will cost more per student to operate the smaller school ($4800 in teacher costs) than the larger school ($2666 in teacher costs). This of course is a gross oversimplification for the purpose of discussion.

      Public school budgeting is a topic that is very difficult to discuss because there are so many variables at play.

      1. LarrytheG Avatar

        I clearly don’t have the width and breadth of knowledge that you have but I was under the impression that the State specified minimum SOQ staff positions and the LCI helped localities do that funding but left additional funding for more/other staff for local funding.

        True? Not True?

        1. Matt Hurt Avatar

          Yes sir, that’s the intention of the LCI.

          1. LarrytheG Avatar

            but it does not “work” ?

            I look at what are NOT SOQ “positions” and wonder if they are for direct SOL support. I presume that SOL teachers are SOQ positions. No?

            I know the funding thing is quagmire… I’ve watched enough school board/BOS joint budget sessions to see at least some of the issues.

            One of the problems -at the local level – is that non-SOQ positions are fully locally funded – including health insurance and retirement and when I look at the LCI report for localities, the column that says local-funding MORE than the match, it’s a much smaller number for SW/rural Virginia than places like Fairfax and Henrico. I think Scott is one that is pretty tight.

            So… if SW does not really spend a lot more locally on school funding – AND they ARE getting good results – I’d think that these are SOQ teachers actually producing better results.

        2. Matt Hurt Avatar

          As far as “SOL teachers are SOQ positions”, this is not necessarily true. The SOQs allot positions on a ratio basis. Sometimes the configuration of the school doesn’t fit nicely in the ratio. For example, the SOQs require (and the state pays for its part based on the LCI formula) 1 teacher for every 24 students in grades K-3. If a school has 30 students, they have to have another teacher in that grade, but the state only pays its share of the first teacher. If an elementary school has 30 kids per grade, the state pays its share of 7.5 teachers whereas the school actually employs 12 teachers.

          1. LarrytheG Avatar

            okay.. But I thought some positions were full time SOQ and others not. no?

            So in an elementary school, you could have grades that test SOLs being taught by teachers that are not SOQ funded?

          2. Matt Hurt Avatar

            The state just looks at the division enrollment and makes their allocations based on the SOQ funding formula and the LCI. They don’t say you have X or Y number of positions, they just provide a dollar amount, and each division has to make it work from there. All that money goes into the same pot with all of the local and federal dollars.

            Yes, if a school has more kids in a grade level than are allowed per the SOQs, but not enough to fund another full time teacher based on the funding formula, then the division is responsible for coming up with the fraction of the position’s salary not covered in the SOQ funding formula.

          3. LarrytheG Avatar

            Matt, I’m told that some positions are not “funded” from SOQ money – like nurses, or assistant principals, and in high schools not all foreign languages, sports, music, etc.

            no?

            When the LCI says “required local match” – is that for ANY positions not SOQ positions?

          4. Matt Hurt Avatar

            Below is linked the actual SOQ document that outlines the staffing positions. For example, the SOQ provides for “Assistant principals in elementary schools, one half-time at 600 students, one full-time at 900 students”. Therefore, every elementary school that enrolls less than 600 students and has a full time assistant principal, that assistant principal is funded 100% locally.
            https://www.doe.virginia.gov/administrators/superintendents_memos/2020/258-20a.docx

            The SOQs don’t mandate all positions, but mainly sticks to teachers, principals, assistant principals, counselors, librarians, technology positions, and a few others. There are other state funds that provide some funding for other positions. One can really drive him/herself crazy trying to account for every employee by funding stream. It’s kind of a fool’s errand.

            The required local match only relates to the SOQ funding formula, not any other funding streams. There is also a required local match, which encompasses other state programs outside the scope of the SOQs.

            I understand the basics of state funding, but to really understand it fully would require a master level course worth of work. What I have described barely scratches the surface.

          5. LarrytheG Avatar

            re: ” The required local match only relates to the SOQ funding formula,”

            Yes. But you CAN see the EFFECT of this if you compare the counties on the percent of “more” over and above the required match especially with regard to rural counties and urban counties.

            I KNOW it is alphabet soup to a certain extent but I also think the INTENT of the SOQs is to address basic academic standards and performance.

            The interesting thing about CIP is that most of those counties do not add near as much extra to the required match as more urban counties , YET , they seem to manage to produce better results especially with regard to ED kids.

            That’s remarkable but it’s also frustrating because so little is really provided in up-front disclosure about how they do it and what (for instance) I would actually advocate for in my local school district other than “contact Matt Hurt”!

            It was confirmed to me that some elementary schools may have to add non-SOQ teachers because of the ratios AND that some positions maybe 1/2 time between schools rather that a full-time dedicated person per school.

          6. Matt Hurt Avatar

            There is no need for frustration. The divisions in the CIP simply work together to develop a pacing guide (what to have taught during which quarter), develop common assessments (to provide an objective measure on which kids need help with which skills), and work through the data to figure out what’s working, what’s not, and what could be tweaked. I’m not sure what you don’t understand about this, but there’s certainly no veil of secrecy hiding any secret sauce. From a framework viewpoint, it’s really that simple. Now, shifting culture and changing priorities to make the “main thing the main thing” is a different story sometimes.

          7. LarrytheG Avatar

            I have several teacher friends that I bounce some of this stuff of of. None of them knew about CIP… but they were supportive of the concept. I could not give them a definitive link to specifics.

  35. LarrytheG Avatar

    Still working my way through the slides – lots to see and try to understand.

    First question: Why does Southside spend near the top on a per student basis, highest staffing levels but has among the lowest teacher pay?

    What does that mean?

    1. Matt Hurt Avatar

      When you begin to consider public school funding, you quickly go down a rabbit hole that has many tunnels and chambers. The LCI is a means by which the state tries to provide equity for public education, but it does not accomplish this very well. Then, you have the local funding. Some localities value public education more as measured by the fact that they allocate a greater fraction of the county/city budget to public education, and others value it less so. After that, it comes to the local school board that is tasked with allocating the funds to the different priorities within the division.

      Region VIII has the second smallest average school enrollment and the second smallest average division enrollment. Despite how many students are enrolled, each division and school is required to accomplish those tasks mandated by federal and state laws and regulations. Larger institutions can take advantage of economies of scale to get these things done more efficiently. Just because a division or school is small, they don’t get a deferment on meeting these requirements, and thus it typically costs more on a per student basis.

      As far as staffing goes, a larger school can operate more efficiently than a smaller school. Take for advantage state class size requirements. There are certain factors that dictate minimum class sizes at the elementary level, but for the sake of this discussion, let’s say that we have to maintain no more than 24 students per teacher. A small school may have 25 students in a grade, and they must employ two teachers in that grade to meet the requirement. A larger school may have 90 students, and they have to employ 4 teachers. Given the same cost per teacher (let’s use $60,000 as a rough estimate), it will cost more per student to operate the smaller school ($4800 in teacher costs) than the larger school ($2666 in teacher costs). This of course is a gross oversimplification for the purpose of discussion.

      Public school budgeting is a topic that is very difficult to discuss because there are so many variables at play.

      1. LarrytheG Avatar

        I clearly don’t have the width and breadth of knowledge that you have but I was under the impression that the State specified minimum SOQ staff positions and the LCI helped localities do that funding but left additional funding for more/other staff for local funding.

        True? Not True?

        1. Matt Hurt Avatar

          As far as “SOL teachers are SOQ positions”, this is not necessarily true. The SOQs allot positions on a ratio basis. Sometimes the configuration of the school doesn’t fit nicely in the ratio. For example, the SOQs require (and the state pays for its part based on the LCI formula) 1 teacher for every 24 students in grades K-3. If a school has 30 students, they have to have another teacher in that grade, but the state only pays its share of the first teacher. If an elementary school has 30 kids per grade, the state pays its share of 7.5 teachers whereas the school actually employs 12 teachers.

          1. LarrytheG Avatar

            okay.. But I thought some positions were full time SOQ and others not. no?

            So in an elementary school, you could have grades that test SOLs being taught by teachers that are not SOQ funded?

          2. Matt Hurt Avatar

            The state just looks at the division enrollment and makes their allocations based on the SOQ funding formula and the LCI. They don’t say you have X or Y number of positions, they just provide a dollar amount, and each division has to make it work from there. All that money goes into the same pot with all of the local and federal dollars.

            Yes, if a school has more kids in a grade level than are allowed per the SOQs, but not enough to fund another full time teacher based on the funding formula, then the division is responsible for coming up with the fraction of the position’s salary not covered in the SOQ funding formula.

          3. LarrytheG Avatar

            Matt, I’m told that some positions are not “funded” from SOQ money – like nurses, or assistant principals, and in high schools not all foreign languages, sports, music, etc.

            no?

            When the LCI says “required local match” – is that for ANY positions not SOQ positions?

          4. Matt Hurt Avatar

            Below is linked the actual SOQ document that outlines the staffing positions. For example, the SOQ provides for “Assistant principals in elementary schools, one half-time at 600 students, one full-time at 900 students”. Therefore, every elementary school that enrolls less than 600 students and has a full time assistant principal, that assistant principal is funded 100% locally.
            https://www.doe.virginia.gov/administrators/superintendents_memos/2020/258-20a.docx

            The SOQs don’t mandate all positions, but mainly sticks to teachers, principals, assistant principals, counselors, librarians, technology positions, and a few others. There are other state funds that provide some funding for other positions. One can really drive him/herself crazy trying to account for every employee by funding stream. It’s kind of a fool’s errand.

            The required local match only relates to the SOQ funding formula, not any other funding streams. There is also a required local match, which encompasses other state programs outside the scope of the SOQs.

            I understand the basics of state funding, but to really understand it fully would require a master level course worth of work. What I have described barely scratches the surface.

          5. LarrytheG Avatar

            re: ” The required local match only relates to the SOQ funding formula,”

            Yes. But you CAN see the EFFECT of this if you compare the counties on the percent of “more” over and above the required match especially with regard to rural counties and urban counties.

            I KNOW it is alphabet soup to a certain extent but I also think the INTENT of the SOQs is to address basic academic standards and performance.

            The interesting thing about CIP is that most of those counties do not add near as much extra to the required match as more urban counties , YET , they seem to manage to produce better results especially with regard to ED kids.

            That’s remarkable but it’s also frustrating because so little is really provided in up-front disclosure about how they do it and what (for instance) I would actually advocate for in my local school district other than “contact Matt Hurt”!

            It was confirmed to me that some elementary schools may have to add non-SOQ teachers because of the ratios AND that some positions maybe 1/2 time between schools rather that a full-time dedicated person per school.

          6. Matt Hurt Avatar

            There is no need for frustration. The divisions in the CIP simply work together to develop a pacing guide (what to have taught during which quarter), develop common assessments (to provide an objective measure on which kids need help with which skills), and work through the data to figure out what’s working, what’s not, and what could be tweaked. I’m not sure what you don’t understand about this, but there’s certainly no veil of secrecy hiding any secret sauce. From a framework viewpoint, it’s really that simple. Now, shifting culture and changing priorities to make the “main thing the main thing” is a different story sometimes.

          7. LarrytheG Avatar

            I have several teacher friends that I bounce some of this stuff of of. None of them knew about CIP… but they were supportive of the concept. I could not give them a definitive link to specifics.

        2. Matt Hurt Avatar

          Yes sir, that’s the intention of the LCI.

          1. LarrytheG Avatar

            but it does not “work” ?

            I look at what are NOT SOQ “positions” and wonder if they are for direct SOL support. I presume that SOL teachers are SOQ positions. No?

            I know the funding thing is quagmire… I’ve watched enough school board/BOS joint budget sessions to see at least some of the issues.

            One of the problems -at the local level – is that non-SOQ positions are fully locally funded – including health insurance and retirement and when I look at the LCI report for localities, the column that says local-funding MORE than the match, it’s a much smaller number for SW/rural Virginia than places like Fairfax and Henrico. I think Scott is one that is pretty tight.

            So… if SW does not really spend a lot more locally on school funding – AND they ARE getting good results – I’d think that these are SOQ teachers actually producing better results.

  36. LarrytheG Avatar

    Gonna add this – you probably know these but some won’t:

    https://vaspa.net/images/va_region_map.jpg

    Interesting that CIP does not seem to include all of region 7 and IS in some others in Region 3?

    1. Matt Hurt Avatar

      All of Region VII is in the CIP.

  37. LarrytheG Avatar

    My mistake….

    I think you did have a slide that showed Region VII SOL performance before CIP was instituted – and after?

    1. Matt Hurt Avatar

      Slides 20-34 display the regional pass rates from 2006 to 2019. The first implementation year of the CIP was 2016.

Leave a Reply