It Matters Where You Seek COVID Data

VDH chart of COVID-19 deaths over time in Virginia’s Northern Region, as of 9/5. Click for larger view.  Having been hit the worst early, it is now doing better than ROVA.

By Steve Haner

Even when there is no intent to twist the data, it still matters where you look if you want to see Virginia’s status in dealing with Our Permanent Pandemic.

The chart on the daily death count, for example, looks dramatically different on the Virginia Department of Health’s website when compared to the Virginia Public Access Project daily updates. It is clear example of how the same data can seem vastly different based on presentation.

What apparently is going on is that as VDH issues daily updates, the compilers at the health department account for each death on the date of actual death, which means 20 new reports on one day might be spread out back a week or more. At VPAP, the daily count is the daily count.

So, you get this chart below from VDH, as of Saturday.  See the steady decline in deaths, and the huge difference from the early peak to the present day.

VDH chart of statewide deaths over time, as of 9/5. Click for larger view.
VPAP chart of Virginia deaths over time, as of 9/5. Click for larger view.

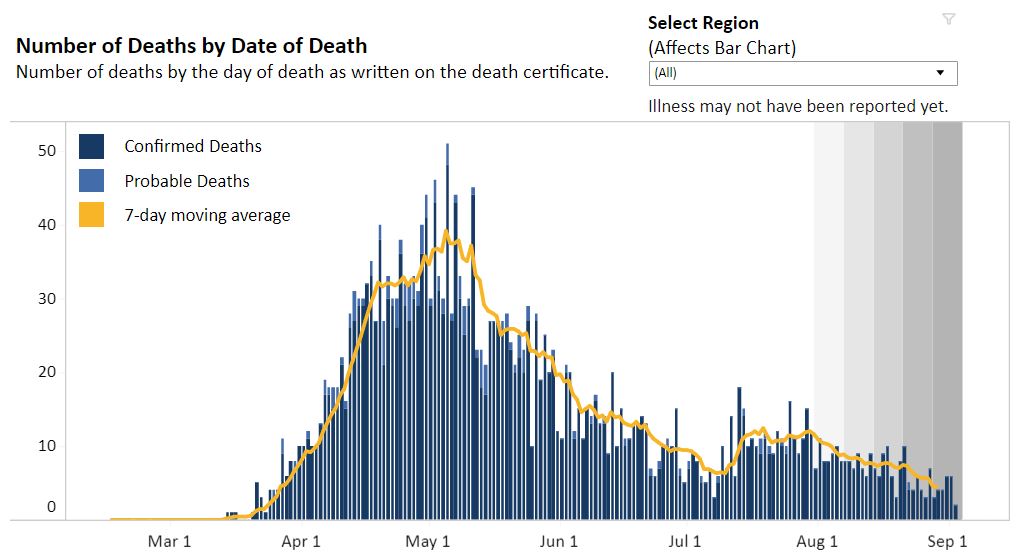
The VPAP bar chart and seven-day average show more peaks, and a would lead you to conclude Virginia is in more dire shape. It shows a seven-day average death rate of about 15, almost three times the VDH chart’s seven day average below of below six. Fifteen versus six is a huge deal.

VDH chart of daily deaths in Virginia’s Central Region (Richmond Metro) as of 9/5. Click for larger view.

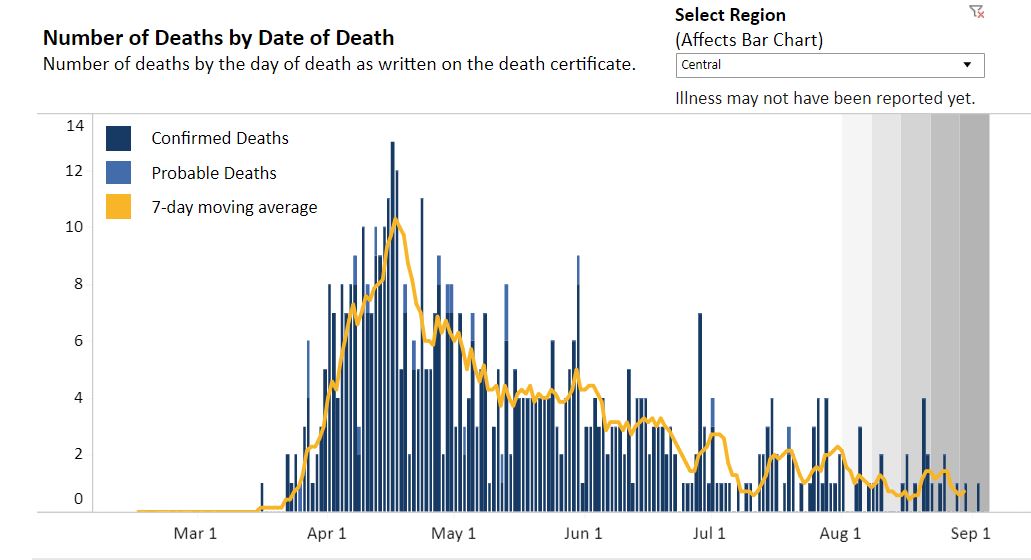
VDH now has regional bar charts, as well, and some regions seem to be doing quite well. Both the Central Region (Richmond Metro) and the Northern Region (DC suburbs, chart at the top) have steadily maintained average death rates below one per day. It is still the case that more than half the deaths are in nursing homes and other congregate settings, so the risk outside those facilities may be lower still.  (But not gone, folks, keep the guard up.)

In those parts of Virginia, things look very much as they did three weeks ago, when last I mentioned things were improving.

Then there is the key metric of hospital admissions. VPAP is tracking the number of beds in use, but VDH is tracking the daily new admissions. Daily new admissions are steadily declining, now down to under 30 per day from a peak of 50 or so August 2. That’s the number to actually care about.

On the Joe Biden for President channels (CNN, MSNBC, MSM) the story of the weekend – in the continuing saga of “we’re all going to die thanks to Trump” – is about the coming wave of COVID-19 after we all behave stupidly over Labor Day. On the Donald Trump for President channel, mainly Fox News, it is getting less attention.

No question, there will be a surge of cases from the opening of the colleges as the students actually do behave stupidly in large numbers. JMU sending them all home was incredibly unhelpful. There will likely be more from Labor Day activities. The panic over K-12 school openings is off the chart — at “put Xanax in the water supply” levels.

But keep watching the hospital admissions as the first indicator of real trouble, and the best predictor of future morbidity. Watch them on the VDH’s web page.(And thank you, VDH, for continuing to improve utility of your reports.)


Share this article


ADVERTISEMENT

(comments below)


ADVERTISEMENT

(comments below)


Comments

28 responses to “It Matters Where You Seek COVID Data”

  1. One can paint a vastly different picture based on how data is presented. It also matters what is tracked and included. I object to the singular focus on COVID-19 and the exclusion of injury and deaths resulting from efforts to contain it.

    It would be dishonest for oncologists to record success rates using only the number of patients who ended up dying of cancer, while ignoring how many ended up dying from the cancer treatment. If one attempts to treat a cancer, and the patient dies from kidney failure or some other side effect of the cancer treatment, it’s hardly a success.

    In our efforts to deal with COVID-19, how many have died and will die from the harmful side effects of closures and lockdowns?

    1. Steve Haner Avatar
      Steve Haner

      https://www.cdc.gov/nchs/nvss/vsrr/covid19/excess_deaths.htm

      Without doubt the first order estimate of that comes from the CDC “excess deaths” calculation linked above. (Scroll down a bit on the page.) That would include direct COVID deaths, deaths from other causes where COVID shoved them over the edge early, and deaths that may be blamed on the economic disruption or the refusal to seek medical care because of the massive fear stoked by the media.

      Looking at that chart also blows away the BS that this is just like flu in the past, as you can see the bad flu season of two years ago, with far fewer “excess deaths.” Yet it also clearly matches the state data, as there was a major peak in late spring, and a much lower peak in July, now declining.

    2. Nancy_Naive Avatar
      Nancy_Naive

      “…while ignoring how many ended up dying from the cancer treatment.”

      But, they DO track such, Nate. Remember Vioxx?

      1. “But, they DO track such, Nate. Remember Vioxx?”

        That’s my point.

        1. Nancy_Naive Avatar
          Nancy_Naive

          Yeah, but we know that, for example, traffic deaths dropped in April, May, and June. Insurance companies began refunding premiums because the probabilities dropped.

          Oooh, ooooh, and air quality measurements shot up. Fewer asthma and non-covid respiratory problems.

          Gee, I dunno, Nate. Maybe asking how many have died because of thr shutdown might not give the answer you want.

          1. idiocracy Avatar

            But I heard that traffic deaths went up due to excessive speeding because of lower traffic.

          2. Nancy_Naive Avatar
            Nancy_Naive

            https://crashstats.nhtsa.dot.gov/Api/Public/ViewPublication/812966

            Dropped in the first quarter, but may not be lower in the end, who knows?

            But, I guess what’s important to insurance companies is $ cost .

          3. LarrytheG Avatar

            Now don’t me bringing up actual stats NN, you’ll screw up the narrative about all those folks dying because of our “overreactions” to COVID19…

            Depression, suicides, gawd knows what else…

            Damned pandemic – can’t live with it, can’t live without it.

          4. Nancy_Naive Avatar
            Nancy_Naive

            Well, Larry, the reports appear to agree with you, except that those reports are based on 22 States. Let’s see what the NTSB comes up with for Q2.

          5. Nancy_Naive Avatar
            Nancy_Naive

            Funny you should mention suicide.

            Thursdays are “medicinal ice cream day” for us. While sitting at B&J’s in Yorktown on Aug 22, the whole of the waterfront lit up with cops, fire trucks, ambulances. As we we leaving we walked down to where the action seemed to be…. nothing.

            That’s when I looked up at the bridge… oh damn, a jumper. The cops were talking to someone sitting outside the rails some 70 feet up.

            Told the wife, “okay, let’s go. We’ve got a good 20 years left and the last thing you need is a memory if you see them jump.”

            Apparently they didn’t, but there is nothing about it on the police logs, which is a good thing. Apparently, they respect privacy of the distressed.

          6. LarrytheG Avatar

            Suicide is mentioned as a bad side effect of the pandemic, not having a job, etc..

            More people kill themselves that are killed and a lot of them have jobs or retired. Some die over hopeless health conditions and others because they are alone.

            One can thrive – even unemployed – if they have someone or a family… they can make it work.

            But when you are alone – it’s don’t matter whether you have wealth or a job… look at the entertainers who were wealthy and famous but alone. Look at war veterans who come back and are “alone” even when they have family.

            Depression is a serious disease – has not that much to do with having a job or not despite some who think that and use it as a political narrative…

    3. James Wyatt Whitehead V Avatar
      James Wyatt Whitehead V

      The book about the unintended consequences of Covid is going to be a good read. I wonder if it is even possible to quantify the damage done and how long before the side effects dissipate?

  2. One can paint a vastly different picture based on how data is presented. It also matters what is tracked and included. I object to the singular focus on COVID-19 and the exclusion of injury and deaths resulting from efforts to contain it.

    It would be dishonest for oncologists to record success rates using only the number of patients who ended up dying of cancer, while ignoring how many ended up dying from the cancer treatment. If one attempts to treat a cancer, and the patient dies from kidney failure or some other side effect of the cancer treatment, it’s hardly a success.

    In our efforts to deal with COVID-19, how many have died and will die from the harmful side effects of closures and lockdowns?

    1. Nancy_Naive Avatar
      Nancy_Naive

      “…while ignoring how many ended up dying from the cancer treatment.”

      But, they DO track such, Nate. Remember Vioxx?

  3. Nancy_Naive Avatar
    Nancy_Naive

    Uh, yep. Still it’s188,000 dead, Steve.

    A model, that has to date underestimated the deaths, is predicting nearly 400,000 by the end of December.

    Are you contemplating a change to your personal strategy for avoiding COV2 based on learning that there is a bureaucratic difference in the date of death on a chart?

    PS, it’s possible given the two data sets to estimate a distribution for the delay in reporting. I could do that, if you’d like.

    1. Steve Haner Avatar
      Steve Haner

      Has that model ever been right? Don’t think so. Do you actually believe we’ll have more deaths in the next four months than we did in the first six? I don’t think even you do, as deeply invested as you are in the “we’re all doing to die” POV. Whatever model is scariest, that’s what CNN will plaster on the screen for hours a day….

      I’m not changing my behavior. This was mainly a bit of a lesson on how people need to look closely at statistics. The difference in the data sets is what I cited, and they are thus marked. VDH: date of death and VPAP: date of report. I will admit I’m a bit less worried as a 1) resident of Central Region and 2) NOT a resident of any kind of congregate living. The Eastern VA chart reinforces the Governor’s decision to hold the line there.

      1. It’s about understanding the risk and managing it as we do other risks every day. If I want to visit relatives far away for example, do I drive or fly? In the immediate aftermath of a horrific airline crash that dominates the news media, many additional people will choose to drive. That’s fine, but statistically its hardly safer than flying commercially in the U.S.

        COVID-19 is without question dangerous, especially for high risk individuals. It needs to be addressed by government and the news media. But it’s not smallpox and shouldn’t be presented as such.

        Somewhere I read about a survey of public perception of COVID-19 death rates etc. The perception was far in excess of reality.

      2. Nancy_Naive Avatar
        Nancy_Naive

        In June, the IHME model predicted 200,000 by October. We’re there early.

        Has it ever been right? No. It’s always been wrong. It’s never predicted as many as has died. That’s the point.

        “Prediction is hard, especially about the future.”

      3. Yep, I’m with NN on this one. Steve, the IHME model has been on target, or off for subsequently explainable, factually data-driven reasons, IMO. Here is the current projection that NN refers to: https://covid19.healthdata.org/united-states-of-america?view=total-deaths&tab=trend
        That said, I appreciate what you point out about the VPAP distortion of the curve resulting from the way it compiles its graph versus VDH. And as the relative of families with young children struggling with the schooling of said children this fall, now by remote schooling supervised by parents also trying to hold jobs, I can verify anecdotally the anxiety ‘at “put Xanax in the water supply” levels’ although it bears noting that they strongly support their school systems’ decisions not to hold in-person instruction.

  4. Nancy_Naive Avatar
    Nancy_Naive

    Uh, yep. Still it’s188,000 dead, Steve.

    A model, that has to date underestimated the deaths, is predicting nearly 400,000 by the end of December.

    Are you contemplating a change to your personal strategy for avoiding COV2 based on learning that there is a bureaucratic difference in the date of death on a chart?

    PS, it’s possible given the two data sets to estimate a distribution for the delay in reporting. I could do that, if you’d like.

  5. LarrytheG Avatar

    So here’s yet another way of “measuring” COVID19 that some say could be very useful – perhaps a game-changer?

    ” Sewage science suggests vast virus infection in North Stafford”

    “If what’s in the sewage is any indication, Stafford County has 10 times as many people walking around with COVID-19 than test results suggest.

    Since April, the county has been doing experimental testing at its two wastewater plants to track levels of the virus. It’s a science known as “wastewater epidemiology,” and before anyone pooh-poohs the idea, the technology has been used for decades to detect polio in countries where it hasn’t been eradicated. It’s also used to estimate the prevalence of opioid abuse in American communities, according to Stat news website.

    The Stafford facilities are among more than 100 wastewater treatment plants nationwide—and only four in Virginia—that are participating in a no-cost pilot program to analyze samples for evidence of COVID-19.

    “Sewage contains valuable information on human health,” the county posted in a news alert in May, because metabolites—or small molecules—from viruses, bacteria and chemicals are excreted in urine and feces.”

    https://fredericksburg.com/news/local/sewage-science-suggests-vast-virus-infection-in-north-stafford/article_33f9693b-1f19-5cee-8dc4-b1f65f930862.html#tracking-source=home-top-story-1

    1. Nancy_Naive Avatar
      Nancy_Naive

      Saw that some time back. Fascinating. Sometimes man’s ingenuity is astounding… but then we eff it up with a monumentally stupid choice for a leader.

    2. “If what’s in the sewage is any indication, Stafford County has 10 times as many people walking around with COVID-19 than test results suggest.”

      It’s possible that many of the people in that area are asymptomatic and have not gone for testing. There are also multiple strains of COVID-19 out there, and I believe some are more dangerous than others. That’s all just speculation, but hopefully we will learn more in the future.

      1. Steve Haner Avatar
        Steve Haner

        Yes, the total number of infections vastly exceeds the number being recorded, and it therefore follows the true case fatality rates are vastly lower than officially reported.

        1. LarrytheG Avatar

          I agree with that and also, one way to do testing more efficiently is in groups – like neighborhood groups…

          the more data we collect – the more opportunity we have to better understand – as long as we don’t get tangled up in interpreting it.

        2. I agree with LG here: randomized sampling is the only way to get a check on this — but then, testing the sewage is a kind of rough randomized sampling, too, at least geographically.

    3. This article would suggest we are closer to herd immunity than otherwise indicated. But still there’s a long way to go before I’m lowering my guard on that account. The fall covid statistics are going to get worse before they get better. Happy Holidays by Zoom, everyone!

  6. LarrytheG Avatar

    So here’s yet another way of “measuring” COVID19 that some say could be very useful – perhaps a game-changer?

    ” Sewage science suggests vast virus infection in North Stafford”

    “If what’s in the sewage is any indication, Stafford County has 10 times as many people walking around with COVID-19 than test results suggest.

    Since April, the county has been doing experimental testing at its two wastewater plants to track levels of the virus. It’s a science known as “wastewater epidemiology,” and before anyone pooh-poohs the idea, the technology has been used for decades to detect polio in countries where it hasn’t been eradicated. It’s also used to estimate the prevalence of opioid abuse in American communities, according to Stat news website.

    The Stafford facilities are among more than 100 wastewater treatment plants nationwide—and only four in Virginia—that are participating in a no-cost pilot program to analyze samples for evidence of COVID-19.

    “Sewage contains valuable information on human health,” the county posted in a news alert in May, because metabolites—or small molecules—from viruses, bacteria and chemicals are excreted in urine and feces.”

    https://fredericksburg.com/news/local/sewage-science-suggests-vast-virus-infection-in-north-stafford/article_33f9693b-1f19-5cee-8dc4-b1f65f930862.html#tracking-source=home-top-story-1

Leave a Reply