Intelligence, Bell Curves and SOLs

This is the ninth in a series of articles about Virginia’s Standard of Learning assessments.by Matt Hurt

A measure that has gained some credibility among psychologists is the Intelligence Quotient (IQ). IQ scores tell us nothing about someone’s intrinsic worth as a human being or their rights to equal justice under the law. On the other hand, most folks would agree that IQ does measure something real. Not every human being is capable of becoming a brain surgeon.

Whatever your opinions about the validity and usefulness of the IQ metric, it is important when thinking about educational policy in Virginia to understand that it does not measure the same thing as the state’s Standards of Learning (SOLs). SOLs are “criterion referenced” tests — that is, they measure how well students have mastered skills and content taught in schools, not their capacity to learn.

There is no question that academically gifted students find it easier to master the skills assessed by the SOL tests than less gifted students do. Yet it has been demonstrated repeatedly that less academically capable students still can acquire the skills they need to be classified as proficient and advance to the next grade level.

Let’s consider an extreme case, students with intellectual disabilities (ID). This group is a small subset of the population with disabilities subgroup that receive special education services under the federal Individuals with Disabilities Act. In Virginia, students with an IQ of two standard deviations below the mean (meaning 70 on an IQ test where the mean is 100) and exhibit significantly impaired adaptive skills are identified as Intellectually Disabled (page 38). In 2019 there were 8,740 students with this label out of more than 1.2 million students in Virginia.

For the purpose of this essay, all SOL data are from the 2018-2019 school year. This was the last year in which SOL tests were administered prior to the COVID pandemic. As was discussed in the “How COVID School Closures Impacted SOL Test Scores” essay, our educational response to the pandemic as a state and the variation of responses among the divisions significantly skewed the SOL data. In an effort to simplify this topic, we’ll focus on the more reliable, pre-pandemic data.

In 2019, the SOL pass rates in Math for students with intellectual disabilities in Virginia was 11.1%. Given the small number of students (tested student populations of less than 50 students are suppressed in the public SOL reports) VDOE published only division-level data for this subset of the SPED subgroup of fourteen divisions. Those pass rates ranged from 1.32% to 42.5% (Wise County), with only five divisions scoring in the double digits. In fact, Wise’s pass rate for this subset of students was within ten points of the OVERALL (all students) math pass rates for three divisions that same year.

The vast majority of educators typically have the lowest expectations of this subset of students, who by definition have the lowest IQs. If Wise County can get students with intellectual disabilities to perform at that level, is it not reasonable to expect that the vast majority of students across the commonwealth should be capable of scoring at least proficient?

When folks think of measures of score distributions (grades, IQ, etc), they typically think of a Bell curve. Quite often, that is how scores are distributed. However, it’s not helpful to think of proficiency in similar terms.

Proficiency on the SOL test is an arbitrary level of performance assigned by the Virginia Board of Education. If students score above that point, they pass and are considered at least proficient. Those scoring below that point fail and are not considered proficient. Cut scores for proficiency are scaled for each SOL test so that students who score at least 400 pass.

Figure 1 below illustrates the normal distributions of the 2019 Math 3 SOL results for all 8143 students in our CIP consortium who took that test. In a Bell curve, 95% of the results fall within plus/minus two standard deviations (SD) of the mean. In this instance, the mean score was 446, and 95% of the students’ scores ranged from 390 to 558.

Distribution Curve for 2019 3rd-grade math SOL for students in school districts participating in the Comprehensive Instructional Program.


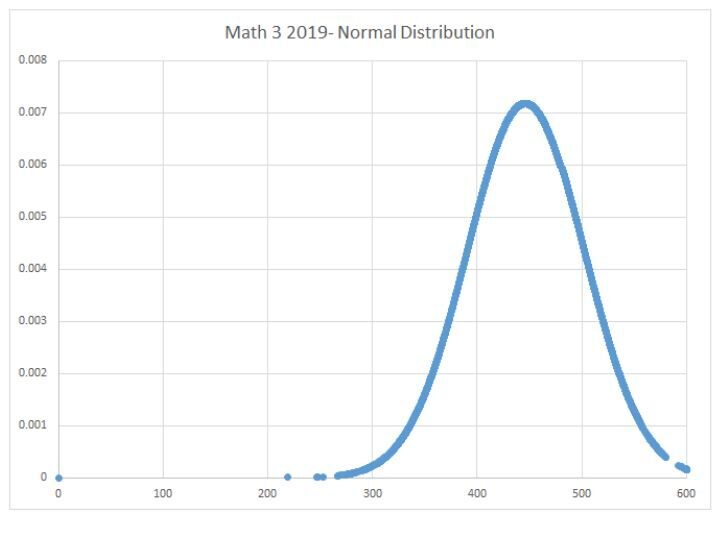
Figure 2 displays the normal distributions of the Math 3 results of the division in our consortium with the highest pass rate (94.4%) for that test (orange) and the division with the lowest pass rate (52.2%- blue). 

Notice the difference in the two Bell curves. This difference is not due to the difference in innate abilities of the students in those two divisions. Students in those divisions have an equal capacity to learn math. The Good Lord doesn’t cause the less capable math students to be born in one geographic location and the more capable math students to be born in another.

This difference is due to the instructional programs in those divisions. It’s what the adults are doing, not the kids they get. Individual kids scores do fall along a bell curve, but the proficiency line is at a different point on each division’s bell curve. There is no indication that some students are doomed to fail simply because of any circumstance inherent within those children. The biggest factor which impacts their proficiency outcomes are what the adults in their schools do with them.


Share this article


ADVERTISEMENT

(comments below)


ADVERTISEMENT

(comments below)


Comments

90 responses to “Intelligence, Bell Curves and SOLs”

  1. LarrytheG Avatar

    These yellow/blue bell curves are for Region 7 districts that participate in CIP (as opposed to all Va school divisions, right?

    I got a little confused between the IQ discussion and the SOL scores…. seemed like it switched gears at some point and the last half is not about IQs at all so then I wondered what the IQ discussion was really about and how it related to the SOL bell curves….

    1. Nancy Naive Avatar
      Nancy Naive

      Reinforcing the notion of a Bell Curve. Of course, while shaped like a Gaussian, obviously the distribution doesn’t quite fit measurements like IQ. For example, a Gaussian would include negative IQ with some probability.

      1. LarrytheG Avatar

        This was discussion in BR a few years back about Charles Murray and the Bell Curve. I was less than impressed.

        1. Nancy Naive Avatar
          Nancy Naive

          Last I saw IQ was the ratio, expressed as a percentage, of mental age to chronological age, i.e., 100 is a person who acts his age.

          Given the advanced ages of BR contributors, and their self-ascribed high IQs, they thus have the mental abilities of persons over 105. Uh yep.

          1. dave schutz Avatar
            dave schutz

            “ratio, expressed as a percentage, of mental age to chronological age, i.e., 100 is a person who acts his age.” That was the original mechanism of assigning a score, when the measure was developed in France around 1900 – so someone with the intellectual capabilities usual to an 8 year old, if 10, would have an IQ of 80. What Matt Hurt is describing is the more recent practice of describing the rarity of a ten year old with those intellectual capabilities in terms of standard deviations, and 1 SD was fifteen points. So an IQ of 80 would be assigned to someone with abilities equal to those of people who did one and a third SD less well than the average.
            It happened that for children, the two mechanisms of developing a score yielded relatively similar numbers, which was confusing. But they are not the same.

      2. Matt Adams Avatar

        “Nancy Naive LarrytheG • 4 hours ago
        Reinforcing the notion of a Bell Curve. Of course, while shaped like a Gaussian, obviously the distribution doesn’t quite fit measurements like IQ. For example, a Gaussian would include negative IQ with some probability.”

        Normal Distribution (Gaussian) doesn’t use negative numbers, it can’t be a negative number. The equation won’t allow it.

        At this point I definitely question your claims of being a mathematician with a master degree.

        1. Nancy Naive Avatar
          Nancy Naive

          Okay, please review the zero-mean, Gaussian probability density function again then state that again. The domain is the set of Reals, the RANGE is greater or equal to zero.

          https://wiki.analytica.com/images/4/4a/Normal%280%2C1%29.png

          In this graph, x is IQ, y is p(x), which like all probabilty is non-negative.

          1. Matt Adams Avatar

            Not applicable, and it’s normal distribution. Your use of Gaussian is pointless.

            And just for your edification, is someone were to have a negative IQ, they wouldn’t have a functioning brain. It’s impossible, so again I question your claims to knowledge in math, because of this and several other mistakes that a freshman wouldn’t make.

          2. Nancy Naive Avatar
            Nancy Naive

            WTF! The Gaussian is the Normal. Go to wiki or somethinng.

            That’s the point Matt, describing IQ with a normal distribution would allow negative IQ, an impossible situation.

            God, you are dense!

            But, i am curious as to how long you will continue to not understand.

            “Of course, while shaped like a Gaussian, obviously the distribution doesn’t quite fit measurements like IQ. For example, a Gaussian would include negative IQ with some probability.”

            People use the Gaussian as a matter of convenience because of it’s shape, unimodal, and described completely by its first two moments,, but it is not the underlying pdf for IQ.

          3. Matt Adams Avatar

            Where did I say Gaussian wasn’t? The problem is unless you’re attempting to appear to be the smartest person in the room you refer to it at Normal Distribution.

            “That’s the point Matt, describing IQ with a normal distribution would allow negative IQ, an impossible situation.”

            No, no it wouldn’t. Which is the point you fail to understand. Your standard practice is to make a statement, when confronted with that statement you bring up an obscure not applicable situation and apply it.

            “But, i am curious as to how long you will continue to not understand.”

            I’m curious how long it will be until you stop personally attacking people whom you disagree with?

          4. Nancy Naive Avatar
            Nancy Naive

            I cannot respond to your indecipherable ramble anymore. Reread my first post with your newly aquired knowledge that a Gaussian and Normal Distribution are the same distribution and that the domain of the distribution is the real numbers, whereas IQ is at best the positive reals, although one imagines that a small subset of the positive reals is more likely.

            Whether you write Normal, or normal, it is the same. Whether you write Gaussian or Normal, it is the same.

            Do you always accuse those who know more about a specfic subject than you of “just showing off”. That will get you everywhere.

          5. Matt Adams Avatar

            “I cannot respond to your indecipherable ramble anymore. Reread my first post with your newly aquired [sic] knowledge that a Gaussian and Normal Distribution are the same distribution and that the domain of the distribution is the real numbers, whereas IQ is at best the positive reals, although one imagines [sic] that a small subset of the positive reals is more likely.”

            I already knew they were the same thing, which was stated in my first comment.

            Normal Distribution (Gaussian) doesn’t use negative numbers, it can’t be a negative number. The equation won’t allow it.”

            “Do you always accuse those who know more about a specfic [sic] subject than you of “just showing off”. That will get you everywhere.”

            That’s the problem, you don’t. You merely just think you do.

          6. Nancy Naive Avatar
            Nancy Naive

            “”Normal Distribution (Gaussian) doesn’t use negative numbers, it can’t be a negative number. The equation won’t allow it.””

            Which is, false. You are wrong. It “uses” negative numbers. It does not produce a negative number. But then I never said it did.

            The Normal distribution does accept a negative number.
            p(x) = root(2pi)/s * exp[-( (x-m)^2)/(2s^2) )]

            For a Normal with mean, m=0, and standard deviation, s=1, the probability p(-1) = p(1). You have a calculator. Plug it in.

          7. Matt Adams Avatar

            False, normal distribution will not use negative numbers. Which is why you employed a specific instance normal probability distribution, which isn’t applicable.

            The normal distribution function is as follows:

            f(x) = (1/((2pi*s^2)^-1/2)) e^( -(1/2)(x-m/s)^2)

            s = standard deviation
            m = mean

            https://www.sciencedirect.com/topics/earth-and-planetary-sciences/normal-density-functions

            How about you use the correct formula, Mr. Mathematician. These exercises where you continue to use incorrect equations is becoming a pattern.

          8. Nancy Naive Avatar
            Nancy Naive

            Good. That has both of us copying it wrong.

            We both have the multiplicative constant wrong. Minor. It just scales things.

            “All multiplicative constants can be set to one anyway, i.e., 2pi = 1, or c if you like, it won’t change any important results anyway.”

            But, let’s reqroup. What did you mean by “use” when you said “Normal Distribution (Gaussian) doesn’t use negative numbers….”?

            Please note. In the source formula you cited, m,s, and x can all be negative numbers with no ill effects. So I don’t understand what you mean by “doesn’t use negative numbers”.

          9. Matt Adams Avatar

            I provided you with exact equation. Your equation wouldn’t just mess with the scale, you completely missed numerator.

            “But, let’s reqroup [sic]. What did you mean by “use” when you said “Normal Distribution (Gaussian) doesn’t use negative numbers….”?”

            The mean and standard deviation can be chosen make the probability of negative outcome very small. Also nothing that all probability is typically contained within 3 or 4 s of the mean, so the s required to reach zero play no role.

            It is what is used for the SAT. Where there will never be anything but a positive mean.

          10. Nancy Naive Avatar
            Nancy Naive

            No you did not. You made two mistakes. One in the constant and one in the argument of the exponent. I’ll let you find them.

            Thank you. Still you haven’t explained “use”.

            However, you have shown that you understand that if y is a normally distributed random variable with mean 1000 and standard deviation of 1, then the probability that y = -1 is not zero. It is incredibly small, positive, but not zero. In fact, for all y, from negative infinity to infinity, this is true.

            So, should someone claim that IQ is normally distributed, would that be a valid assumption? Note, I said “valid” as opposed to “practical”.

          11. Matt Adams Avatar

            “No you did not. You made two mistakes. One in the constant and one in the argument of the exponent. I’ll let you find them.”

            Completely and utterly false, the eq I provided is a direct representation of the PDF, term for term. I’m sorry you have a problem admitting error, thus was a similar situation when you couldn’t figure out how many zeros were in a billion.

            You can claim to say whatever you’d like but 99% of your posts are edited so that’s why you engage in word games.

            IQ can be modeled using ND and it’s practical because ND is predicated upon the mean value, which in IQ’s case would be positive.

          12. Nancy Naive Avatar
            Nancy Naive

            A down arrow is a poor apology, Matt. As to pointing out your little booboo, sorry, not sorry. Hey, it was a mistake. Anyone could have made it, but anyone didn’t. You did.

          13. Matt Adams Avatar

            “Nancy Naive Matt Adams • 2 minutes ago
            A down arrow is a poor apology, Matt. As to pointing out your little booboo, sorry, not sorry. Hey, it was a mistake. Anyone could have made it, but anyone didn’t. You did.”

            Dude you didn’t even use the right f’n equation and instead of being an adult and admitting your error you attacked me.

          14. Nancy Naive Avatar
            Nancy Naive

            Aw…

          15. Matt Adams Avatar

            This is the 3rd time you’ve screwed up simple equations, which lends me to believe your touted credentials aren’t true.

          16. Nancy Naive Avatar
            Nancy Naive

            Or, I’m 70, with poor close-in eyesight and memory that’s beginning to slide, all while using a crappy old iPad that locks up on the BR site requiring page reloads and edits. From now on, I shall include “DONE” at the bottom when finished.

            It was a mistake. I had forgotten it was 1/(s*root(2pi)). Should have taken the time to look it up.

            DONE.

          17. Matt Adams Avatar

            No, your a pompous individual who makes excuses doesn’t own their mistake.

          18. Nancy Naive Avatar
            Nancy Naive

            You’re. You are.

          19. Matt Adams Avatar

            Oh the irony, the fact that you’re picking on that error while ignoring your own I pointed out for you above. Go find the bold and [sic] pappy, next time take your ginkgo.

          20. Nancy Naive Avatar
            Nancy Naive

            (1/((2pi*s^2)^-1/2)) Please verify this is exactly what you typed
            = (2pi*s^2)^1/2. (Eliminating the negative exponent)
            = s*(2pi)^1/2.

            You put a -1/2 exponent. That is wrong.
            Should have been
            (1/((2pi*s^2)^1/2)
            Or
            ((2pi*s^2)^-1/2)

          21. Matt Adams Avatar

            That’s not located in the exponent of the equation, that’s the coefficient yes, I in error added a (-) when representing sqrt.

            Still a far cry from you completely incorrect equation as follows:

            “p(x) = root(2pi)/s * exp[-( (x-m)^2)/(2s^2) )]”

            Which despite your insistence would do more than just have implications on magnitude.

          22. Nancy Naive Avatar
            Nancy Naive

            The errors are nonetheless comparable. So, what did we learn? Point out the error, “the root 2pi should be in the denominator, Dude”.

            But, lookie, you learned something, “For a Gaussian, or Normal, random variable, the probability density function, p(x) > 0 for all x.”

          23. Matt Adams Avatar

            I learned nothing, as I already learned in Engineering Statistics my junior year of college as well as tested on it for the F.E.

          24. Nancy Naive Avatar
            Nancy Naive

            “I learned nothing”
            That I believe.

            Then the FE must be very easy.

          25. Matt Adams Avatar

            Of of course, it’s super simple. It’s just 5.5 hours of discipline specific material. You’d have some troubles though, you have to develop pseudo-code and know how many zeros are in a billion. Outside of that you might struggle with the equations, typically it’s four answers they are just separated by magnitude. So if you can’t get that equation right, you’ll fail. I mean I’m just saying because you seem to think that magnitude and proper equations are for the little people.

            Say did you make it through Calc 3, because if you didn’t you’d fail the exam as well.

          26. Eric the half a troll Avatar
            Eric the half a troll

            Psssttt… it is open book….

          27. Nancy Naive Avatar
            Nancy Naive

            Oh? Well then, that must be where he developed his Google skills, and his quick command of the facts.

    2. Matt Hurt Avatar

      The point I was attempting to make (poorly it seems) was that there is little reason why the vast majority of kids in the Commonwealth can’t be at least proficient on our SOL tests. There’s lots of reasons why they’re not being as successful as they could be, and all of those reasons lay at the feet of the adults.

      1. LarrytheG Avatar

        maybe only poorly in my case…

        I’ve never thought about the SOL in terms of bell curves… to be honest. I’m sure I don’t understand but wouldn’t you need individual scores to construct such a bell curve or did you just get the mean and add the 2 sigmas?

        Would the scores really graph out that way?

        The essential point you are making, I agree with – that it’s adults that affect how much of their potential kids can achieve – at least certainly in the early grades where fundamental skills are taught and developed.

        But Sherlock makes a point also that even districts with high mean scores can have individual schools that are not good, at the same time others in that district are top-notch. The mean district score could be showing a district with some really good schools with ones that are not and on that basis – listening to you and James W- each school has it’s own leadership, teaching staff and academic culture (and also my personal teaching friends agree).

  2. James C. Sherlock Avatar
    James C. Sherlock

    You take about the differences between divisions. As you know, we also see differences within divisions.

    Schools are very complex systems, and no one is exactly like the other. But they all respond to leadership, good and bad. You have provided a lot of superb leadership in Region 7 and beyond. The kids are lucky to have you.

  3. LarrytheG Avatar

    The thing I LIKE about Mat’s essays is they are thoughtful, objective informative, and not ideological or blame game and diatribes against public schooling.

    One presumes that Mat believes in public schooling and is committed to improving it but he also lays out the issues, including the good, bad and ugly of SOLs and low expectations without ascribing motives like ‘soft bigotry”.

    If I understand the chart correctly – even within Region 7 – even within those that participate in CIP – there are differences in scores…. on district basis -and I presume school basis.

    If I don’t, lay it on me… help me understand better.

    1. Matt Hurt Avatar

      Well, I strongly believe that if a kid is provided with a strong foundation in the basics, primarily literacy and numeracy skills, that the kid has a great opportunity to do great things in life. I don’t think that such skills would destine anyone to greatness, as there are all manner of life events that cause stumbling blocks, and some folks are more resilient to such things than others. However, without that opportunity, what do they have?

      I also believe that educators can provide those opportunities to kids. I get very frustrated when I see large swaths of kids fall through the cracks. I get upset when I see the adults who are responsible for seeing to it that those kids get these opportunities allow them to fall through the cracks.

      While I understand that there are some very significant historical, structural, and cultural (school and division cultures) maladies that provide ample stumbling blocks, human beings have proven very adept at overcoming stumbling blocks. Why is it that we can invent wondrous technological marvels, bring the vast human population out of the most dire abject poverty in which we spent most of our history, but we allow a student’s zip code to be the best predictor of whether he or she will become proficient in basic literacy and numeracy skills.

      1. LarrytheG Avatar

        You’ve said a mouthful, and I don’t disagree with any of it. It’s a puzzle of sorts, but the fails seem to be more prevalent when there are large numbers of at-risk kids in schools that serve low-income neighborhoods..

        JAB and Cranky are always hammering on RPS on that basis – even though JAB lives in Henrico and some of it’s low-income schools close to Richmond are also not so good.

        I remain a skeptic that Charter, non-public or choice schools can do a better job – until I see their actual academic performance results as well as their demographics that include the kids who typically do worse in public schools.

        I can’t believe anyone would actually advocate for these alternative schools without some level of actual proof that they actually do better.

        Once that proof if provided, I have no problem what-so-ever in providing tax money for those schools, but not cart before the horse.

  4. LarrytheG Avatar

    If I understand correctly, Virginia’s cut score as measured by NAEP is the lowest or near lowest in the nation, yet on actual academic performance (as measured by NAEP), Virginia scores higher that many other states.

    So, does the Va SOL cut score match up with the NAEP score for the low bar for basic proficiency?

    I can’t add charts here right now because the NAEP website is down.

    But basically the question is how do Va SOL scores map with regard to the NAEP proficiency standards (which are fairly detailed descriptions of skills).?

    I’ll try later to see if NAEP is back up and provide the graphs.

      1. LarrytheG Avatar

        I saw them by the y-axis confused me. Would those same charts with the Y-axis being the scale scores be different/better?

        1. Matt Hurt Avatar

          Somewhat, but the real shift is in the x-axis.

          1. LarrytheG Avatar

            Yep, but without the scale scores, it harder to really understand – at least for me. but also – the public cannot get access to all the individual scores in a school or school district… so I’m presuming these bell curves are really the mean/average scale score at the top then the rest of the bell curve is just drawn and does not actually represent actual individual scores.

            It’s an interesting approach… but I’d wonder if the actual school-district wide individual data was available that it would actually end up being a “perfect” bell cure…

            Then I’d also be interested in a given school district or school to see superimposed bell curves that represent the subgroups and whole school curves.

            (Are all kids (anonymized) scores available to the public?

            And finally, again, I note that we have almost nothing like this at all for the non-public schools that some seem to advocate almost blindly… just asserting they are better….without
            really any academic performance data nor demographics and sub-groups.

  5. Nancy Naive Avatar
    Nancy Naive

    SOL = Trivia retention test. A correct answer only means that the student gained and retained a useless fact. It does not mean that the fact was taught or not taught, in class, or that the student is not good at guessing.

    1. LarrytheG Avatar

      I think some of that is true and Mat alluded to it. How would you better measure academic performance?

      1. Nancy Naive Avatar
        Nancy Naive

        Certainly NOT by developing a standardized test that drives curriculum.

        1. LarrytheG Avatar

          Anytime you decide to test – doesn’t that test end up doing that?

          Take a Professional Engineer test or a Medical “Board Certified” test, etc?

          better ways?

          1. Nancy Naive Avatar
            Nancy Naive

            In the PE test, the goal is to license the engineer. Quality Control of the profession, not to design the curriculum of the enginnering student. Not saying they aren’t related, and I’m sure schools use “our students have an 83% pass rate”, but then they also select their students.

          2. Matt Adams Avatar

            “Nancy Naive LarrytheG • 10 minutes ago
            In the PE test, the goal is to license the engineer. Quality Control of the profession, not to design the curriculum of the enginnering [sic] student. Not saying they aren’t related, and I’m sure schools use “our students have an 83% pass rate”, but then they also select their students.”

            Engineers are required 5 years of mentorship by a P.E. in the field before they can sit for the P.E. test. The FE is the gateway which is taken in the spring of the Senior year. Neither are items are tracked by Universities because they aren’t required and are often not applicable to most individuals in the field of Engineering.

          3. Nancy Naive Avatar
            Nancy Naive

            Thank you for that far more extensive description.

            But, are you also implying that all engineering schools do not track PE/FE pass rates for PR reasons?

            Take, for example, this https://www.law.virginia.edu/career-services/bar-passage-data-recent-graduates

          4. Matt Adams Avatar

            They don’t.

            A PE is not required to work in the field of Engineering. It is required to be a PE with a stamp.

            The P.E. and or F.E. have zero association with the school or their programs. Also, unless a school or program track is accredited you cannot sit for the F.E. and therefore cannot attain a P.E.

            I was a party to a situation where my University was generating a new track within my degree. You had a option to stick with the original track which was accredited or diverge to the new one. In that instance I was eligible to take the PE, while my cohort who choose the 2nd path was not.

          5. Nancy Naive Avatar
            Nancy Naive

            They don’t what? Advertise their pass rates for the FE/PE?

            Again, thank you for the example. The point was to Larry’s question on PE and SOL. In the latter, the results are used to change the curriculm for one difference. But more importantly, the college picks the student first. So minimal comparison.

          6. LarrytheG Avatar

            For quite a few professions – there are certification tests to ascertain your knowledge and skills for that job.

            The claim that the test is wagging the dog is a little chicken/egg in that those tests actually are determining if you do have the skills and knowledge to perform that job.

            I don’t see SOLs and NAEP testing as fundamentally different in what they are testing for to be honest.

            You set the goals for skills and knowledge, you teach them and then you measure to determine if BOTH the student and the educators have succeeded.

            We know that there can be and are failings on both sides of that.

            But to not measure because of concerns about testing leaves us with no real way to know if we are succeeding or not or where we are succeeding and where we are not.

            It would be tantamount to educating an Engineer then not certifying that they actually have the skills and knowledge to be a Professional.

            Ditto for a lot of profession from train engineers to doctors to soldiers and weapon system operators.

          7. Matt Adams Avatar

            Correct, they don’t advertise their pass rates because it has zero correlation with the school and is not required to work.

            The F.E. and the P.E. are standard tests, they test competency. They show what you don’t know as with any multi-choice exam.

          8. Nancy Naive Avatar
            Nancy Naive

            At least one does…
            https://www.grace.edu/grace-college-engineering-graduates-boast-100-pass-rate-on-fe-exam/

            There more in the search results, BTW. Granted, they were Mechies….

          9. Matt Adams Avatar

            F.E. isn’t the PE and a College touting that their 3 seniors passed the F.E. first try isn’t what you were implying. Besides that news and blogs for the College not for perspective students.

            The F.E. is a standard Exam that is created by NCEES. School curriculums don’t teach to pass the F.E. or PE. They teach you to what is required to be accredited.

            Edit: It’s a College not a University

          10. Nancy Naive Avatar
            Nancy Naive

            Yes, and no.

            But, the SOLs were sold as a test of the system, not a test of the student.

            I watched as my daughter’s schools used past SOL tests as teaching guides. “The SOL two years ago had 3 questions on The Battle of Yorktown, we must therefore teach the facts of that battle.”

          11. LarrytheG Avatar

            so a better way to measure?

          12. Nancy Naive Avatar
            Nancy Naive

            The effectiveness of the system? Tough problem. I don’t know. But what they’ve done is changed the system, not measure it.

          13. LarrytheG Avatar

            How about NAEP proficiency standards?

            what do you think of this:

            Mathematics Standards of Learning for Virginia Public Schools – February 2009 Grade Three

            https://www.doe.virginia.gov/testing/sol/standards_docs/mathematics/2009/stds_math3.pdf

          14. Nancy Naive Avatar
            Nancy Naive

            The violated the first rule of observation — be as unobtrusive as possible. They test entire student body over weeks and have turned the test into a competition by making the results public. I can’t say more.

          15. LarrytheG Avatar

            NCLB goal was to make schools be transparent and accountable for their performance.

            If there are no SOLs, how do we measure academic performance and how does the public know of success or failure?

          16. Matt Hurt Avatar

            Notice the reference to the HISTORY test. You are exactly right here.

          17. Nancy Naive Avatar
            Nancy Naive

            It was the first that came to mind. I’m sure that I could find the same to be true in mathematics testing as well. But, I don’t remember such from the #1 kid unit’s math courses. But I can damned well guarantee that somewhere, sometime, someone looked at the 4th grade math SOL and said, “There were 5 questions on improper fractions, spend more time on factoring.”

          18. LarrytheG Avatar

            but aren’t we talking about actual proficiency rather than memorization? One could argue about which proficiencies are important or more – but at the end of the day , how could/would we measure academic proficiency without some kind of test?

          19. Matt Hurt Avatar

            That’s true, but how is that bad? If kids don’t understand those foundational skills, how can they build upon them, especially when those skills are sequential from one year to the next? If they don’t understand those improper fractions, they’re going to have a hard time in later math courses.

          20. Nancy Naive Avatar
            Nancy Naive

            But, you pointed out the best way to do this — Finland. So, we know the solution.

          21. Matt Hurt Avatar

            These teachers do that as well. If their kids aren’t proficient, they make them so. They just don’t rely on state tests- they create their own with their very high expectations.

          22. LarrytheG Avatar

            so you support the way that Finland tests/ascertains academic performance and competence?

          23. Nancy Naive Avatar
            Nancy Naive

            No, Matt cited it. I’ll take his word for it.

            But, in a previous article the author compared a SW rural county to a NOVA county for better performance on the SOLs for all, and minority students. Of course the pay for teachers in the rural county was 1.5x the median income for that county as opposed to 3/4 the median income in NOVA.

            I cannot say that alone made the difference, but ignoring it is surely wrong.

        2. Matt Hurt Avatar

          If you’ll read the Smartest Kids in the World, specifically the section on Finland, you can see that they made teachers rock stars, paid them extremely well, made the profession highly competitive to get into, and everyone had very high expectations. Due to this culture, they didn’t really need such assessments. Unfortunately, we don’t have those conditions in this country.

          https://www.amazon.com/Smartest-Kids-World-They-That/dp/145165443X

          1. LarrytheG Avatar

            We not only don’t have those conditions but we have folks that impugn and demonize public school teachers and public schools…right here in BR.

          2. LarrytheG Avatar

            had not heard of that book, might need to read it.. just checked it out.

          3. Nancy Naive Avatar
            Nancy Naive

            Yes. Absolutely. But we’re trying to do it on the cheap. In 1970, the most prestigious job was not POTUS. It was college professor. What more can one say?

            The US suffers from NIH — Not Invented Here. We just refuse to copy from the smart kids. Take healthcare, for example.

          4. LarrytheG Avatar

            so I’m at a loss if we agree that measuring is necessary but no recommendation as to how……

    2. Matt Hurt Avatar

      When you refer to the HISTORY SOL tests, you are exactly right. On those tests, students pretty much simply have to recall discrete facts that are printed in the Curriculum Frameworks. THESE TESTS are primarily what have given SOL tests a bad name in general. The way you prepare a student to be successful on the HISTORY SOL tests is the old drill and kill method. In fact, this is completely antithetical to what we want kids to come out of those classes with. Instead of understanding, we push trivia. The SOL test in HISTORY doesn’t measure understanding.

      However, with regards to math and reading, you could not be more wrong. The math and reading SOL tests measure student proficiency on skills. So far, I cannot find anyone who can argue that proficiency on those skills is not something to be highly desired in our students. I would urge anyone who has issue with this to review the Curriculum Frameworks for those content areas to see what students are expected to know, do, and understand.

      The problem with this is that folks paint all SOL tests with the same wide brush. The history SOL tests should all be abolished- they serve as a distraction to what we really want kids to come out of those classes with.

      The reading and math SOL tests are not perfect, but until the perfect measure comes along, we had better heed that data because it is a decent evaluation of our educational efforts in those content areas.

      1. LarrytheG Avatar

        And I agree with Matt on that and so do some of my teacher friends… who say that the History (and some other SOLs) are crap and take up enormous time and resources and actually take time away from things like reading and math.

        I posted standards for Grade 3 math on another post here… but one could also look at the NAEP proficiency standards for Reading and Math and see that discrete skills are involved not memorization at all.

      2. Nancy Naive Avatar
        Nancy Naive

        What are we measuring? Student proficiency? Or the system proficiency? Yes, they are correlated, but the idea is to identify best practices, not just best school.

        We’ve lost control of the whole process.

        1. LarrytheG Avatar

          Each kid does receive a score – right? What we don’t do is report individual scores but rather school level scores.. which, I agree, is a measure of the school but derived from actual student scores.

          1. LarrytheG Avatar

            Do we report all the SOL scores for all kids in the school – publically (not names, just scores?) I thought just the score for the groups were.

          2. Matt Hurt Avatar

            Student level data is reported to the school, the division, and the student’s parents, but not to the public due to FERPA regulations.

      3. James Wyatt Whitehead Avatar
        James Wyatt Whitehead

        Social Sciences needs the SOL test Mr. Hurt. History has to have some skin in the game. Otherwise resources and teachers will be directed to other places with greater need. Good history teaching can be measured.

        1. LarrytheG Avatar

          History is not unimportant but if a kid has not learned to read – history is irrelevant if he/she cannot read and understand it.

          1. James Wyatt Whitehead Avatar
            James Wyatt Whitehead

            Mr. Larry. A great history teacher is demanding reading and a deep comprehension of material. Writing is demanded as well. My specialty was teaching the skill of defending an argument in essay. We go hand in hand with the English teachers. Foreign language teachers are an additional direct supporters. A great music teacher exposes students to important moments in literature and history with sound. The art of teaching is quite a tapestry.

          2. LarrytheG Avatar

            Oh you don’t need to convince me but for kids that are behind or disadvantaged, reading should be prioritized.

            A kid who cannot read or write well in the 7th grade is probably not going to do well at things like history, much less earn a decent living and not need entitlements.

            I found myself much more interested in history as I got older and realized how much I did not know and that some of which I thought true history, not.

        2. Matt Hurt Avatar

          I agree, but the SOL tests do a horrible job of measuring the beneficial outcomes of a history class. Performance Based Assessments/Problem Based Learning, or whatever you want to call it measures desired outcomes from those classes much better than an SOL test. I want kids to understand what happened, and why it happened, not just be able to regurgitate the simple who, what, where, and when.

Leave a Reply