Housing Values and School Quality

Virginia school proficiency levels. Source: StatChat. Click to enlarge.

by James A. Bacon

In an essay posted earlier this week on the StatChat blog, Spencer Shanholtz with the Demographics Research Group at the University of Virginia explored the relationship between housing values and school quality. He documents the reality that children living in census tracts with low-value housing are more likely to attend low-performing schools. He finds this disturbing. “Children in lower-cost housing should be able to attend good schools,” he says.

I quite agree. Every child should be able to attend a good school. The pertinent question is whether it is necessary for a school to be located in an affluent neighborhood and have students from affluent families in order to accomplish that goal.

In this, first of two blog posts, Shanholz provides some useful data. It would unfair to critique his argument until he publishes the second post. For now, let’s take a look at the case he makes and raise some questions for him to answer in his follow-up post.

The first challenge is to measure school quality. Shanholz uses a school proficiency index developed by the Department of Housing and Urban Development designed to “help communities analyze challenges to fair housing choice” and “address the fair housing barriers in their community.” Percentile-ranked values range from 1 to 100. Higher scores indicate higher qualities schools.

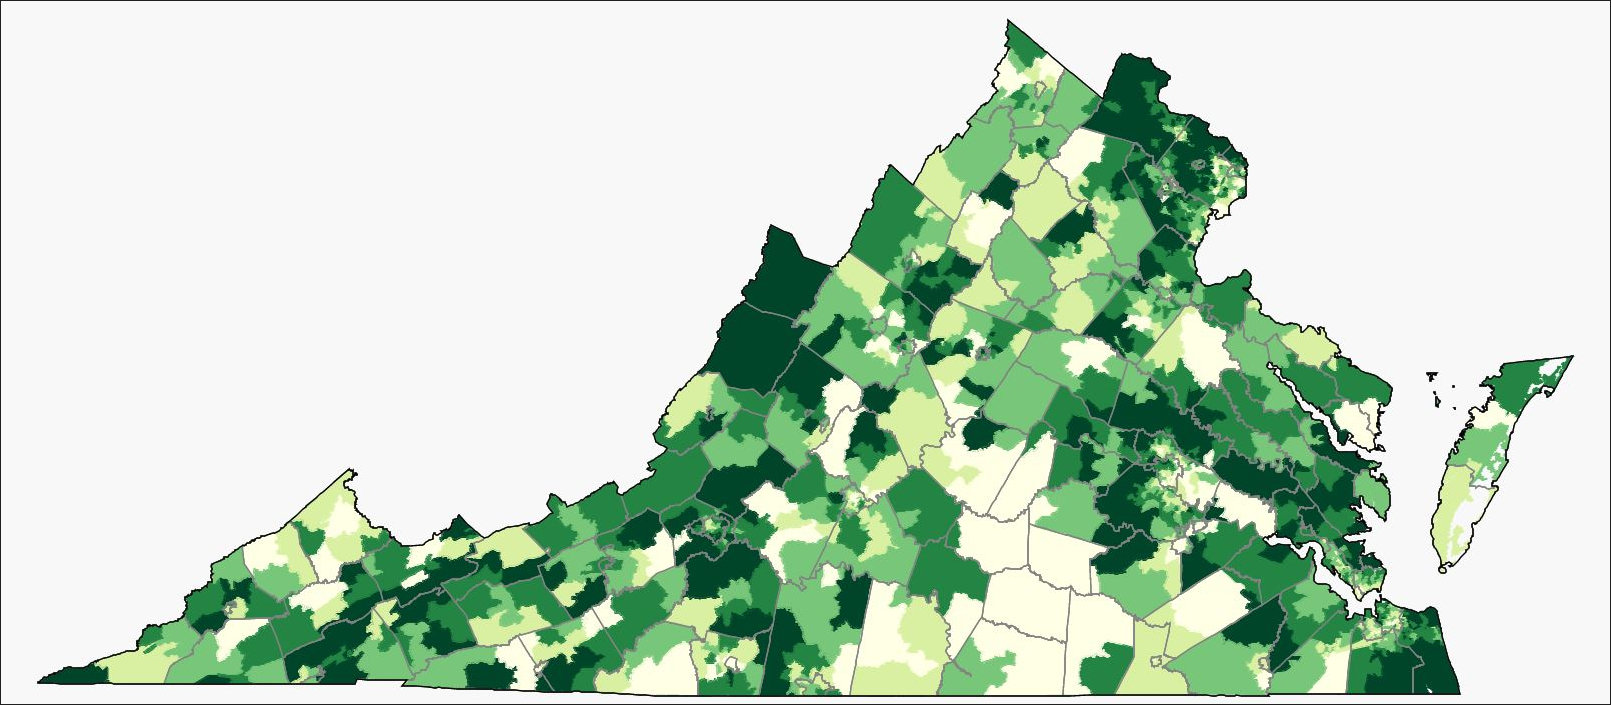
School proficiency levels vary widely across Virginia, Shanholz writes.

High-performing schools tend to be clustered in the suburbs around the state’s major metro areas and in certain rural neighborhoods. Regionally we see the highest average school proficiency index in the Hampton Roads region at 59, followed by Northern Virginia at 53. The West Central and Valley regions are also above the state average of 45. Southside has the lowest mean school proficiency score by far at 21.

Some rural areas buck the larger trend. Rural Bath County scores highest in the state with a school proficiency index of 92, followed by exurban New Kent County at 91, and urban Falls Church at 91. Then come suburban Loudoun, rural Highland, and Covington, a small city in a rural setting, at 82.

Despite the exceptions, Shanholz notes that average school proficiency index increases with median housing values.

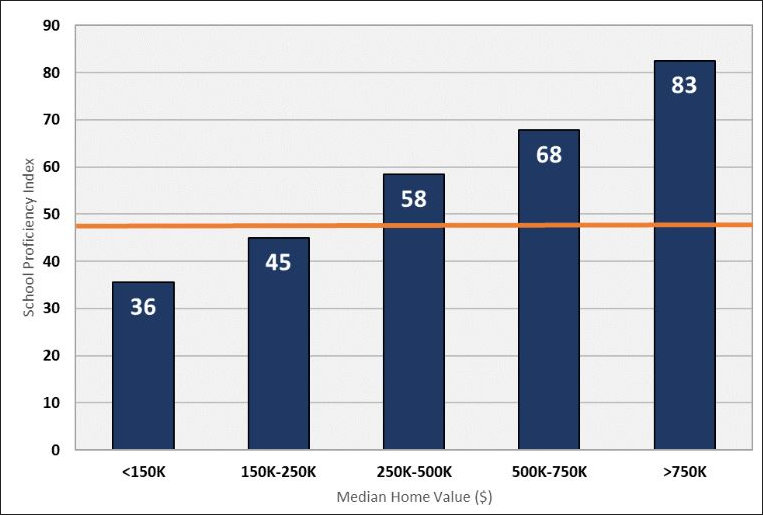
Shanholz argues that the high price of housing in census tracts with the best schools essentially price poor households out of neighborhoods with good schools — a defensible proposition. He then concludes, “The anecdotal relationships presented here demonstrate the difficulty of obtaining low-cost housing in an area where a family can send their children to a quality school.”

Bacon’s bottom line: Big question: Are the high-performing schools high-performing because they have better teachers, newer buildings, and more resources — advantages that can be transferred to students from poor families? Or are they high performing because the students attending the schools come primarily from families with educated parents of financial means who pass on their learning to their progeny — advantages that cannot be transferred to students from poor families?

The exceptional performance of places like Bath County, Highland County, and the City of Covington are proof positive that, while more resources might be helpful for creating a high-performing school, they are not essential. Conversely, there are school systems with ample financial resources (the city of Richmond comes to mind) where poor students perform abysmally.

A final observation: Shanholz presents no evidence here that transferring a poor kid to a great school in a wealthy neighborhood will improve that kid’s academic performance. But let’s wait and see what he has to say in Part 2 of his essay. Perhaps he will address these points.


Share this article


ADVERTISEMENT

(comments below)


ADVERTISEMENT

(comments below)


Comments

4 responses to “Housing Values and School Quality”

  1. LarrytheG Avatar

    should not equate “low income” with rural – aka Bath or Highland when much of the other rural is low performing and much of the other low income is poor performing.

    Bath and Highland are outliers not what “could be” unless and until you KNOW what is really different between Bath/Highland and other rural.

    Also note the larger schools districts where inside the school district itself – like Henrico – there is a RANGE of performance between the schools and it’s mostly predictable by neighborhood income.

    IF you have a higher income then you CAN choose a neighborhood with a “good” school. If you do not earn a higher income – you do not have that choice – you live where you can afford and most of the time the school in that neighborhood is not a high performing school – no matter how committed you might be as a parent – the school does not have the higher skilled staff nor the wider/deeper academic programs like AP and BA tracks.

    Low income parents usually are also usually low education and so they were never themselves brought up to recognize “good” schools or advocate for more programs/better teachers either.

    “blaming” parents or race for the problem or public schools for the problem (when we KNOW there are GOOD public schools) is not credible either.

    Perhaps the question is whether we should or do feel responsible for helping the kids to of low income/low education parents … to some level of equity in terms of opportunity.

  2. I’ve looked at Part 1 of Mr. Shanholz’ blog post and while we are waiting for Part 2, where can you enlighten us on the School Proficiency Index — proficiency in what, what factors are measured and how blended, etc.?

    I went looking for a legend to decipher the colors and (via the link you supplied to StatChat) found the original chart here: https://uvalibrary.maps.arcgis.com/apps/Embed/index.html?webmap=abc7ec4c3850424f83f4069abf99b0da&extent=-83.6107,36.3015,-75.4973,39.6731&zoom=true&scale=true&search=true&searchextent=true&legend=true&disable_scroll=true&theme=dark Using this map, which discloses the SPI for each school district you click on below the county or city level, it appears that West Point, VA and the adjacent towns (Mataponi and Eltham), the subject of an earlier post of yours, have a remarkable SPI of 98.

    Perhaps that was to be expected. But there is more: all of northern and eastern Bath County is an equally remarkable 97. Since the SPI scale tops out at 100, all these districts must have schools that are near perfection — or else what’s being measured is misleading or the measurement is inaccurate. Then there’s the remarkable disparity between northwest Dinwiddie (93) and adjacent, demographically near-identical northeast Nottoway (7). And the even more remarkable score for every single district in Prince Edward County (0), even for those in which Hampden Sydney and Longwood U. are located (not likely for a college town). Shanholz says Prince Edward has an average score of 4, but that appears to be borrowed from a portion of Buckingham across the river from Farmville. I don’t know what’s going on here with these statistics but it appears that some of these low SPI scores may actually reflect incomplete or “no response” data sets, not necessarily low proficiency in anything. GI,GO.

  3. LarrytheG Avatar

    I agree with Acbar – We need more background info here to really understand the basis for the scores but to a large extent this really does illustrate that “neighborhood” schools do reflect and confirm the household income and education demographics of the neighborhoods that the schools serve.

    I suspect that Bath and West point have similar income and education levels as other high performing districts and/or they are single school districts where all kids regardless of income/education levels go to that one school which has the full panopoly of programs and teacher staff and that “opportunity” is available to all kids that attend that school.

    The thing we need to move away from is the idea that race or culture are the driving factors for academic proficiency.

  4. Is anyone uncomfortable that the HUD School Proficiency Index data is from 2013-14? http://hudgis-hud.opendata.arcgis.com/datasets/school-proficiency-index
    Shanholtz says, “The updating of the school proficiency index was suspended in early 2018, therefore the most recent data are from 2014. Relative school performance remains largely stable over time.”

    That’s not reflected in DOE SOL pass rates Division wide for 4th grade. I looked at Bath County, Mathews County and Richmond City. (Bath has 2 elementary schools, Mathews 1 and Richmond City 25.)

    From Va Dept of Ed SOL test results – Division by Test and Grade
    http://www.doe.virginia.gov/statistics_reports/sol-pass-rates/index.shtml
    4th grade Reading 2013-14 Math 2013-14
    Bath …. 85 advanced 11 … Math 91 advanced 20
    Mathews …. 62 advanced 18 … math 81 advanced 17
    Richmond City …. 57 advanced 12 … math 74 advanced 16

    4th grade Reading 2014-15 Math 2014-15
    Bath … 77 advanced 17 … Math 61 advanced14
    Mathews … 72 advanced 14 … math 85 advanced 22
    Richmond City … 60 advanced 12 … math 72 advanced 21

    4th Grade Reading 2018-19 Math 2018-19
    Bath … 62 advanced 5 … 74 advanced 8
    Mathews … 84 advanced 23 … 85 advanced 7
    Richmond City … 56 advanced 10 … 65 advanced 8

    So if Bath County has an SPI of 97, how is it Mathews is 30? Definitely needs some explanation.

Leave a Reply