“Equity” and the Performance of Virginia’s Black and White Students

by John Butcher

The estimable Jim Bacon suggests that the Northam administration’s emphasis on “equity” and “restorative-justice” is keeping disorderly students in the classroom to the detriment of the other students. As well, he posits that behavior problems are more common among black students so the effect should be larger in divisions with larger black populations.

VDOE has some data that might speak to those issues.

Elementary and middle school students mostly take the same tests at the same time. High school, not so much. So let’s look at the data for the elementary and middle school grades.

First, the disorder. The Safe Schools Information Resource goes back to 2015. For grades 3-8, the statewide counts there of individual offenders as a percentage of their ethnic population are:

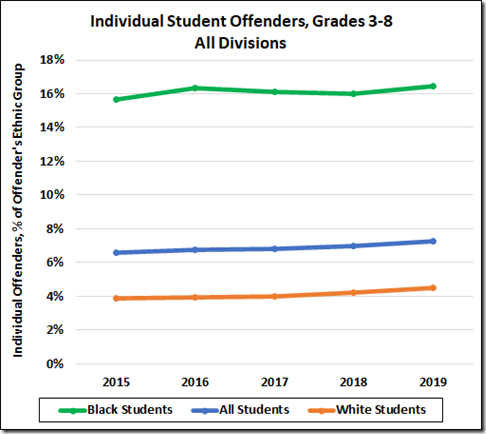
In absolute terms, the 2019 rate of individual offenders for black students, 16.4% is 9.2% higher than the all students rate of 7.3% while the white students’ rate is 2.8% below.

All three rates increased from 2015: All students by 0.7%, black by 0.8%, and white by 0.6%. That is consistent with the Bacon hypothesis and it confounds any notion that the government’s actions are reducing disorder in our schools.

The picture in Richmond is less definitive.

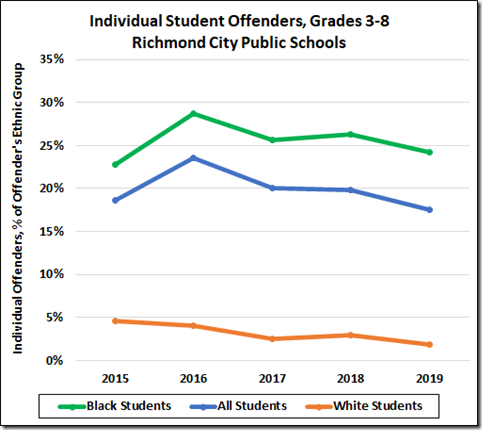
Contrary to the state averages, all three of Richmond’s offender rates decreased after 2016, all students by 6.1%, black by 4.4%, and white by 2.2%

But then there is Fairfax County.

This graph replaces an earlier version. Hat tip to reader WayneS for spotting the error.

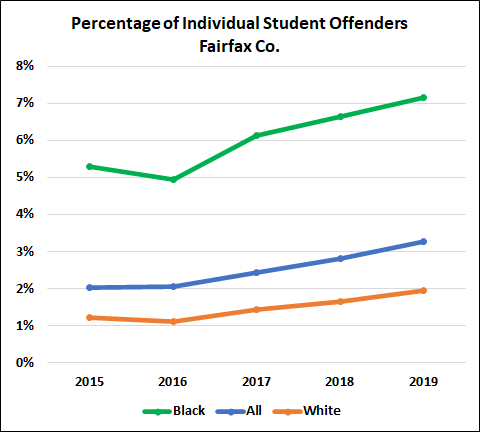
Overall, the Fairfax rate rose by 3.3% (61.5% of the 2015 rate); the black rate increased by 1.9% (35.3% of the ‘15 rate); the white rate, 0.73% (59.9% of the 2015 starting point).

It is tempting to assign the huge increases in the offender counts in Fairfax to the emphasis there on “restorative-justice (pdf)” and “equity.” The smaller increases statewide offer a lesser but still enticing temptation. No telling what those Richmond decreases mean but with a 2019 offender rate of 17.5%, 2.4 times the state average of 7.3%, the only sensible inference is that’s it’s past time to move one’s family to one of the nearby counties.

For sure, something awful is going on in Richmond schools and something is getting worse statewide, much worse in Fairfax.

To look for the possibility of an “equity” effect on performance, let’s turn to the SOL pass rates.

The big two SOL tests are reading and math. First, the state average pass rates on the reading tests.

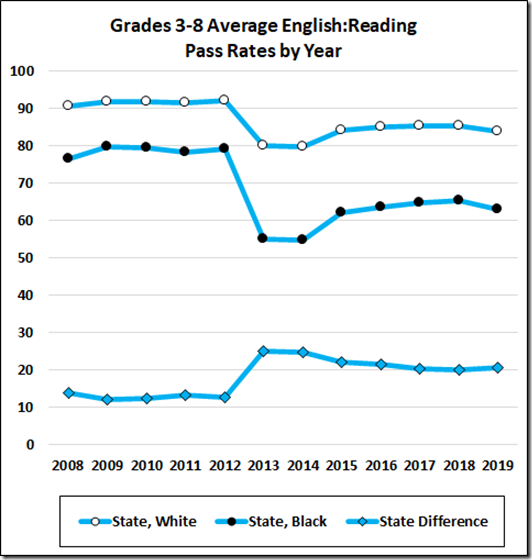
he large drop in 2013 came from new, tougher tests. Those new tests also exacerbated the black/white performance gap.

To the point here, these data show slightly improving pass rates for both black and white students in the first years after the new tests but faltering rates in 2019. During the same period, the gap between black and white students improved (decreased) by 4.0 points, a significant amount, albeit virtually all the improvement came during the recovery, such as it was, from the new tests.

On the math tests, the big drop came with new, tougher tests in 2012. More recently, the pass rates were faltering until they enjoyed a bounce in 2019 from newer, easier tests.  Also in the recent period the black/white gap was worsening slightly but improved a bit with the easier tests.

(There’s a template for making the entire school system look better: Just water down the tests every year.)

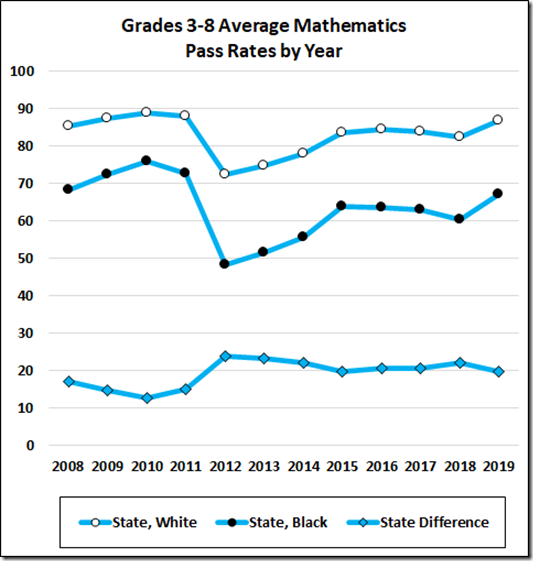
The black/white difference improved by 3.4 points from 2013 to 2019 with, again, most of the improvement coming before the “equity” campaign.

If the Governor has had any effect on pass rates, it’s not obvious here. So let’s turn to a couple of the more interesting divisions.

Richmond has one of the largest percentages of black students in the state.

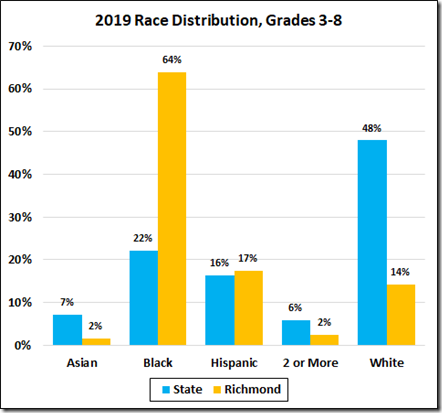
(2019 data. Race group names abbreviated; Am. Indian and Pacific Islander groups both < 0.5% and omitted to simplify the graph).

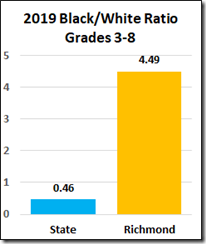
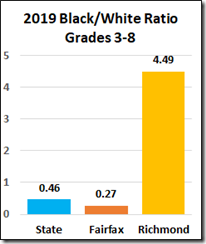
Or, in terms of the black/white ratio,

The Richmond reading data tell a sorry story.

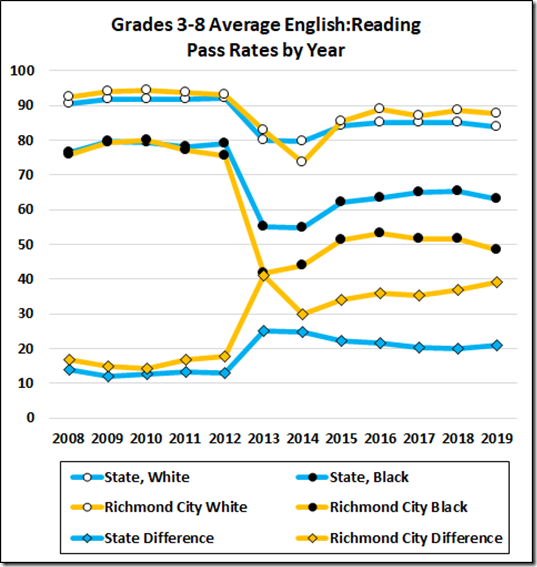
There’s no recent improvement in the Richmond rates; indeed, the (already appalling) rates for the black students have declined some in the last three years while the black/white gap worsened  by 9.5 points. That gap now stands at 39.3, 188% of the state average gap.

On the math tests, the Richmond gap has deteriorated consistently since 2014, landing at 35.9% in 2019.

Turning to Fairfax, a County that has been a leader in the restorative-justice (pdf) movement.

The racial distribution in the Fairfax schools is different from the state average and quite different from Richmond.

Both black and white students in Fairfax consistently beat the state averages for their groups but the black/white gaps closely track the state numbers.

These data suggest that the “equity” movement in the Virginia’s schools has not improved pass rates on the elementary and middle school reading and math tests and has generally failed to halt ongoing deterioration of the black/white rate gaps.

The recent, general decline of these pass rates, except under the new, easier math tests, is consistent with increasing disorder in the classrooms but does not establish a causal relationship.

On these data, Bacon is batting at least .750:

  1. Keeping disorderly students in the classroom: Number of offenders is rising;
  2. To the detriment of the other students: Pass rates are falling;
  3. Behavior problems are more common among black students: Astronomically;
  4. The effect should be larger in divisions with larger black populations: Not so, at least on this very small sample of divisions.

Because of the very small number of divisions in the sample here, I need to look at the data for all the divisions. Stay tuned.


Share this article


ADVERTISEMENT

(comments below)


ADVERTISEMENT

(comments below)


Comments

54 responses to ““Equity” and the Performance of Virginia’s Black and White Students”

  1. TooManyTaxes Avatar
    TooManyTaxes

    I can see focusing on kids eligible for free or reduced price lunches as a workable starting definition for “economically disadvantaged students.”

    I have no idea what “restorative justice” means much less in racial terms. I doubt a group of 25 ordinary people would either.

    1. James Wyatt Whitehead V Avatar
      James Wyatt Whitehead V

      Restorative Justice example. Kid gets caught with a small amount of pot at school. Kid gets a meeting with principal and parents. Kid watches a video about the danger of pot. Kid goes to Sheriffs office kiosk in Sterling and pays a $35 fine. The matter is concluded.
      25 years ago in Loudoun County it would have been a 10 day out of school suspension. Followed by 25 days of drug rehabilitation training at the Douglas Alternative School. Parents, kid, and principal meet to be reinstated back into school. 2nd offense a recommendation for expulsion.

      1. TooManyTaxes Avatar
        TooManyTaxes

        I’m a big believer in second chances for minor offenders. But what does a meeting, video and a $35 fine have to do with “restoration”? I can see requiring a kid who spray painted some graffiti on a wall being required to clean the wall for a first-time offense. That, in theory, is restorative.

  2. LarrytheG Avatar
    LarrytheG

    Congrats on the graphics tour-de-force – but I’m not yet convinced.

    How would you PROVE that higher rates of “disorder” have a direct impact on SOLs? For instance, can you show a similar effect in mostly white schools?

    I hear the correlation argument – but I’m not yet convinced.

    And I agree you need a bigger dataset.

    I don’t know about Richmond but I know in the local school system that students that are “problems” are removed and put into an alternative school.

    1. WayneS Avatar

      “How would you PROVE that higher rates of “disorder” have a direct impact on SOLs?”

      I know it’s not scientific, but have you ever tried to take an important test while someone else in the room was shouting, talking, running around, slapping you in the back of the head, or smoking a joint directly behind you and blowing the smoke over your shoulder?

      But enough about me getting kicked out of my P.E. license test…. 😉


      FYI – That WAS a joke. I am a licensed Professional Engineer in good standing.

      1. LarrytheG Avatar
        LarrytheG

        Oh I buy that completely. But is it a race issue?

        1. WayneS Avatar

          Probably not – I’m no longer even sure WHAT my race is….

      2. Reed Fawell 3rd Avatar
        Reed Fawell 3rd

        WayneS says:
        “I know it’s not scientific, I know it’s not scientific, but have you ever tried to take an important test while someone else in the room was shouting, talking, running around, slapping you in the back of the head, or smoking a joint directly behind you and blowing the smoke over your shoulder?”

        Actually, your point about discipline in classroom is Absolutely Essential to student learning and achievement. This is beyond any doubt. See my comments here on Success Academy classrooms for one of endless examples.

        The corollary rule here is the absolute essential need for parent(s), (plus school and teachers) support that demand their child’s (student) disciplined behavior, learning, and achievement in and outside school. Without these ingredients, working together in support of the child, the child’s chances of success at school and in life drop drastically, often to near zero. And, in this mix the parents roll is the most critical to the child’s chances of success. Without responsible parents, we will continue ruining children by the millions no matter how much money, wailing, and scapegoating is thrown at problem.

  3. LarrytheG Avatar
    LarrytheG

    Congrats on the graphics tour-de-force – but I’m not yet convinced.

    How would you PROVE that higher rates of “disorder” have a direct impact on SOLs? For instance, can you show a similar effect in mostly white schools?

    I hear the correlation argument – but I’m not yet convinced.

    And I agree you need a bigger dataset.

    I don’t know about Richmond but I know in the local school system that students that are “problems” are removed and put into an alternative school.

    1. WayneS Avatar

      “How would you PROVE that higher rates of “disorder” have a direct impact on SOLs?”

      I know it’s not scientific, but have you ever tried to take an important test while someone else in the room was shouting, talking, running around, slapping you in the back of the head, or smoking a joint directly behind you and blowing the smoke over your shoulder?

      But enough about me getting kicked out of my P.E. license test…. 😉


      FYI – That WAS a joke. I am a licensed Professional Engineer in good standing.

      1. LarrytheG Avatar
        LarrytheG

        Oh I buy that completely. But is it a race issue?

        1. WayneS Avatar

          Probably not – I’m no longer even sure WHAT my race is….

      2. Reed Fawell 3rd Avatar
        Reed Fawell 3rd

        WayneS says:
        “I know it’s not scientific, I know it’s not scientific, but have you ever tried to take an important test while someone else in the room was shouting, talking, running around, slapping you in the back of the head, or smoking a joint directly behind you and blowing the smoke over your shoulder?”

        Actually, your point about discipline in classroom is Absolutely Essential to student learning and achievement. This is beyond any doubt. See my comments here on Success Academy classrooms for one of endless examples.

        The corollary rule here is the absolute essential need for parent(s), (plus school and teachers) support that demand their child’s (student) disciplined behavior, learning, and achievement in and outside school. Without these ingredients, working together in support of the child, the child’s chances of success at school and in life drop drastically, often to near zero. And, in this mix the parents roll is the most critical to the child’s chances of success. Without responsible parents, we will continue ruining children by the millions no matter how much money, wailing, and scapegoating is thrown at problem.

  4. Nancy_Naive Avatar
    Nancy_Naive

    Ritalin for all! Hard to believe that 400 years of enforced poverty has taken a toll.

  5. Nancy_Naive Avatar
    Nancy_Naive

    Ritalin for all! Hard to believe that 400 years of enforced poverty has taken a toll.

  6. LarrytheG Avatar
    LarrytheG

    Bacon and Butcher are making an inference with respect to blacks. Could it me that if we look at data for economically disadvantaged, regardless of race, we see something similar?

    The data is there… and Butcher is good at mining it. How about it?

  7. LarrytheG Avatar
    LarrytheG

    Bacon and Butcher are making an inference with respect to blacks. Could it me that if we look at data for economically disadvantaged, regardless of race, we see something similar?

    The data is there… and Butcher is good at mining it. How about it?

  8. WayneS Avatar

    The Fairfax Individual Offender 3-8 graph has a weird-looking x-axis.

    1. Thanks. Jim has posted a corrected version

  9. WayneS Avatar

    The Fairfax Individual Offender 3-8 graph has a weird-looking x-axis.

    1. Thanks. Jim has posted a corrected version

  10. Peter Galuszka Avatar
    Peter Galuszka

    Ok. There is data on classroom disruption. What’s the point? That black kids are more unruly than white lids? Do they just get disciplined more often? What?

  11. Peter Galuszka Avatar
    Peter Galuszka

    Ok. There is data on classroom disruption. What’s the point? That black kids are more unruly than white lids? Do they just get disciplined more often? What?

  12. Tom Banford Avatar
    Tom Banford

    Jim
    Thank you for the link to “Restorative Justice in Fairfax County Public Schools”. The document sets forth the basic premise as “strong relationships with adults and other students are fundamental to learning and resilience”. It goes further to emphasize personal responsibility, encourage collaboration and reintegration rather than punishment and isolation, and to address the use of restorative practices in the classroom to prevent harm and violence. These all seem to be things that center / right individuals could get behind. At first glance restorative justice appears to be building on the intervention model previously used with special education students.
    The Bacon premises of behavior problems are more common among black students and restorative justice and equity are keeping disorderly students in classrooms would appear to point to a solution of taking black students out of classrooms. As Jim’s charts indicate this is actually what the reliance on suspensions as punishment has been doing and it hasn’t worked. It is way past time to try something new even if it is not restorative justice.

    1. LarrytheG Avatar
      LarrytheG

      using the phrase “restorative justice” with respect to behavior issues that are actually more related to economically disadvantaged students – makes one wonder what the phrase actually means….

      do economically disadvantaged families suffer from a loss of “justice” that needs to be “restored”?

      1. TooManyTaxes Avatar
        TooManyTaxes

        There seems to be a trend towards the use of vague terminology in public vision documents. What are “economically disadvantaged students”? How are they defined? How does one ensure the definition doesn’t result in one that is both over- and under-inclusive at the same time? This is most especially true when suspect classifications are involved. SCOTUS has found race, national origin, religion and alienage to be suspect classes that draw strict scrutiny.

        1. LarrytheG Avatar
          LarrytheG

          there are some different measures but the most common is if they are eligible for free or reduced lunch.

          It has absolutely nothing to do with race but the facts are that African Americans have a higher percentage of lower income than their percentage numbers demographically.

          Along with lower income – it’s usually true the parents do not have good educations … ergo – they often do not qualify for higher paying jobs.

          again – this can be true for any race – white, black, Hispanic, Asian

          when we talk of restorative justice in racial terms – what does that mean?

  13. Tom Banford Avatar
    Tom Banford

    Jim
    Thank you for the link to “Restorative Justice in Fairfax County Public Schools”. The document sets forth the basic premise as “strong relationships with adults and other students are fundamental to learning and resilience”. It goes further to emphasize personal responsibility, encourage collaboration and reintegration rather than punishment and isolation, and to address the use of restorative practices in the classroom to prevent harm and violence. These all seem to be things that center / right individuals could get behind. At first glance restorative justice appears to be building on the intervention model previously used with special education students.
    The Bacon premises of behavior problems are more common among black students and restorative justice and equity are keeping disorderly students in classrooms would appear to point to a solution of taking black students out of classrooms. As Jim’s charts indicate this is actually what the reliance on suspensions as punishment has been doing and it hasn’t worked. It is way past time to try something new even if it is not restorative justice.

    1. LarrytheG Avatar
      LarrytheG

      using the phrase “restorative justice” with respect to behavior issues that are actually more related to economically disadvantaged students – makes one wonder what the phrase actually means….

      do economically disadvantaged families suffer from a loss of “justice” that needs to be “restored”?

      1. TooManyTaxes Avatar
        TooManyTaxes

        There seems to be a trend towards the use of vague terminology in public vision documents. What are “economically disadvantaged students”? How are they defined? How does one ensure the definition doesn’t result in one that is both over- and under-inclusive at the same time? This is most especially true when suspect classifications are involved. SCOTUS has found race, national origin, religion and alienage to be suspect classes that draw strict scrutiny.

        1. LarrytheG Avatar
          LarrytheG

          there are some different measures but the most common is if they are eligible for free or reduced lunch.

          It has absolutely nothing to do with race but the facts are that African Americans have a higher percentage of lower income than their percentage numbers demographically.

          Along with lower income – it’s usually true the parents do not have good educations … ergo – they often do not qualify for higher paying jobs.

          again – this can be true for any race – white, black, Hispanic, Asian

          when we talk of restorative justice in racial terms – what does that mean?

  14. TooManyTaxes Avatar
    TooManyTaxes

    I can see focusing on kids eligible for free or reduced price lunches as a workable starting definition for “economically disadvantaged students.”

    I have no idea what “restorative justice” means much less in racial terms. I doubt a group of 25 ordinary people would either.

    1. James Wyatt Whitehead V Avatar
      James Wyatt Whitehead V

      Restorative Justice example. Kid gets caught with a small amount of pot at school. Kid gets a meeting with principal and parents. Kid watches a video about the danger of pot. Kid goes to Sheriffs office kiosk in Sterling and pays a $35 fine. The matter is concluded.
      25 years ago in Loudoun County it would have been a 10 day out of school suspension. Followed by 25 days of drug rehabilitation training at the Douglas Alternative School. Parents, kid, and principal meet to be reinstated back into school. 2nd offense a recommendation for expulsion.

      1. TooManyTaxes Avatar
        TooManyTaxes

        I’m a big believer in second chances for minor offenders. But what does a meeting, video and a $35 fine have to do with “restoration”? I can see requiring a kid who spray painted some graffiti on a wall being required to clean the wall for a first-time offense. That, in theory, is restorative.

  15. Dick Hall-Sizemore Avatar
    Dick Hall-Sizemore

    Congratulations and thanks to John Butcher for crunching this data. It is a lot of data to crunch.

    I need to disagree with some of his conclusions, however. He rightly says that any consistency between “disorder” trends and passing rate trends does not establish a causal relationship. But then he proceeds to imply, at least, a causal relationship by saying that Jim Bacon is batting .750.

    A closer look at the data and Bacon’s corollaries reveals other conclusions:

    1. Keeping disorderly students in the classroom. Yes, that is true. But that is one of the goals of the “equity” or “restorative justice” policies–minimize suspensions and expulsions. After all, students cannot learn if they are not in the classroom. And, what to make of the decline in “disorderly” students in Richmond? Perhaps, the new policies are having a beneficial effect.

    2. To the detriment of the other students. Butcher replies: pass rates are falling. But, he just said these two trends do not establish a causal relationship. If there were a causal relationship, one would think it would show up in Fairfax, which had a significant increase in the number of “disorderly students”, particularly black students. However, the reading and math passing rates for white students in Fairfax stayed around 90 percent for the years 2015-2019. For black students, the reading passing percentages increased until a slight drop off in 2019; the math passing rates stayed around 70 percent and increased in 2019. The increase in disorderly students did not seem to have a detrimental effect on other students.

    3. Behavior problems are more common among black students. Butcher says, “Astronomically.” But, his graphs can be misleading. They show percentages of each ethnic group, not absolute numbers. Therefore, one could come away with the impression that schools in the state are overrun with misbehaving black students. However, if one looks at absolute numbers, the picture is different. Based on DOE figures, the 16 percent of black students who are “disorderly” in 2019 amounted to about 45,300 individuals, while the 7.6 percent “disorderly” white students amounted to about 46,900 individuals. Furthermore, there is evidence that black students are disciplined more often than white students for the same behavior. That would account for some of the disparity in percentages and is one of the motivations behind the “equity” and “restorative justice” policies. https://www.marketwatch.com/story/black-children-are-more-likely-to-be-disciplined-than-white-kids-for-the-same-behavior-2019-10-16

    4. The effect should be larger in divisions with larger black populations. As Butcher points out, the data does not support this corollary.

  16. Dick Hall-Sizemore Avatar
    Dick Hall-Sizemore

    Congratulations and thanks to John Butcher for crunching this data. It is a lot of data to crunch.

    I need to disagree with some of his conclusions, however. He rightly says that any consistency between “disorder” trends and passing rate trends does not establish a causal relationship. But then he proceeds to imply, at least, a causal relationship by saying that Jim Bacon is batting .750.

    A closer look at the data and Bacon’s corollaries reveals other conclusions:

    1. Keeping disorderly students in the classroom. Yes, that is true. But that is one of the goals of the “equity” or “restorative justice” policies–minimize suspensions and expulsions. After all, students cannot learn if they are not in the classroom. And, what to make of the decline in “disorderly” students in Richmond? Perhaps, the new policies are having a beneficial effect.

    2. To the detriment of the other students. Butcher replies: pass rates are falling. But, he just said these two trends do not establish a causal relationship. If there were a causal relationship, one would think it would show up in Fairfax, which had a significant increase in the number of “disorderly students”, particularly black students. However, the reading and math passing rates for white students in Fairfax stayed around 90 percent for the years 2015-2019. For black students, the reading passing percentages increased until a slight drop off in 2019; the math passing rates stayed around 70 percent and increased in 2019. The increase in disorderly students did not seem to have a detrimental effect on other students.

    3. Behavior problems are more common among black students. Butcher says, “Astronomically.” But, his graphs can be misleading. They show percentages of each ethnic group, not absolute numbers. Therefore, one could come away with the impression that schools in the state are overrun with misbehaving black students. However, if one looks at absolute numbers, the picture is different. Based on DOE figures, the 16 percent of black students who are “disorderly” in 2019 amounted to about 45,300 individuals, while the 7.6 percent “disorderly” white students amounted to about 46,900 individuals. Furthermore, there is evidence that black students are disciplined more often than white students for the same behavior. That would account for some of the disparity in percentages and is one of the motivations behind the “equity” and “restorative justice” policies. https://www.marketwatch.com/story/black-children-are-more-likely-to-be-disciplined-than-white-kids-for-the-same-behavior-2019-10-16

    4. The effect should be larger in divisions with larger black populations. As Butcher points out, the data does not support this corollary.

  17. Reed Fawell 3rd Avatar
    Reed Fawell 3rd

    “However, the reading and math passing rates for white students in Fairfax stayed around 90 percent for the years 2015-2019. For black students, the reading passing percentages increased until a slight drop off in 2019; the math passing rates stayed around 70 percent and increased in 2019.”

    In my view the Virginia SOL numbers are falsified and bogus from top to bottom. Look at Federal achievement tests for some measure of honestly and reliability. For details see:
    See: https://www.baconsrebellion.com/latest-sols-more-declines-in-reading-writing/

    1. Reed Fawell 3rd Avatar
      Reed Fawell 3rd

      For an example of the truth instead of state manufactured disinformation (lies) about student K-12 achievement, see:
      https://www.nationsreportcard.gov/reading_math_g12_2015/#reading

    2. Reed Fawell 3rd Avatar
      Reed Fawell 3rd

      See also earlier BR commentary:
      “Please remember that Virginia Board of Education falsified achievement tests of Virginia high school students by upward of 40% so as to falsely claim these kids qualified for a college education when of surely knew that these students did not qualify.

      This conclusion is based on a related series of earlier articles on Bacon’s Rebellion, including for example, these comments of mine, under post titled : Virginia Reading Test Scores Plunge, dated Oct. 30, 2019, namely:

      “Reed Fawell 3rd | October 31, 2019 at 11:06 am | Reply

      Here is an important question on this NAEP reading Proficiency Chart that shows that ONLY 33% OF VIRGINIA’S EIGHT GRADERS ARE ABLE TO READ AT OR ABOVE THE NATIONAL 8TH GRADE LEVEL.

      If that is true then why should we believe that its true that 12th grade kids in Virginia pass Virginia’s Standards of Learning (SOL) at far more than double the NAEP rate (at 8th grade), namely:

      “Reading: 78% pass rate, down 2 percentage points from the previous year.

      Writing: 76% pass rate, down 2 percentage points.”

      See: https://www.baconsrebellion.com/latest-sols-more-declines-in-reading-writing/

      In fact, what normally happens after the 8th grade is that disadvantaged kids and other poor learners (whether advantaged or not), fall even further behind their grade level achievement after the 8th grade. This happens for well known reasons. Thus the majority of American kids are no where even close to “college ready” after they “graduate” from 12th grade, assuming they did not drop out altogether from schooling before then.

      In short, what do 12th grade NAEP proficiency charts tell us about Virginia students who graduate? And how do those figures compare to Virginia’s own SOL charts, and what do the latter have to do with telling us about College readiness? Can we believe them? If so, why?

      Reed Fawell 3rd | October 31, 2019 at 1:14 pm | Reply

      “2015 12th graders reading at 12th grade level nationally per NEAP tests – In 2015, thirty-seven percent of twelfth-grade students performed at or above the Proficient achievement level in reading, according to NEAP test results.

      These test results include following percentage breakdowns for students whose parents had variant educational levels:

      18% pass rate for students whose parents did not finish high school.

      24% pass rate for students whose parents did finish high school.

      36% pass rate for those whose parents had some education after high school.

      And AMAZINGLY ONLY 49% PASS RATE for AMERICAN STUDENTS WHOSE PARENTS HAD GRADUATED FROM COLLEGE COULD READ AT 12th GRADE LEVEL.

      What a remarkable record of gross failure. No wonder most kids learn nothing in college. Now, if we compare Virginia students proficiency rates in 12th grade to their grade level, we will see how honest or dishonest Virginia’s SOL testing is. Good luck finding it.

      Now too, we know why 12th grade NEAP testing results are so hard to find, and often are not published at all, including since 2015.”

  18. Reed Fawell 3rd Avatar
    Reed Fawell 3rd

    “However, the reading and math passing rates for white students in Fairfax stayed around 90 percent for the years 2015-2019. For black students, the reading passing percentages increased until a slight drop off in 2019; the math passing rates stayed around 70 percent and increased in 2019.”

    In my view the Virginia SOL numbers are falsified and bogus from top to bottom. Look at Federal achievement tests for some measure of honestly and reliability. For details see:
    See: https://www.baconsrebellion.com/latest-sols-more-declines-in-reading-writing/

    1. Reed Fawell 3rd Avatar
      Reed Fawell 3rd

      See also earlier BR commentary:
      “Please remember that Virginia Board of Education falsified achievement tests of Virginia high school students by upward of 40% so as to falsely claim these kids qualified for a college education when of surely knew that these students did not qualify.

      This conclusion is based on a related series of earlier articles on Bacon’s Rebellion, including for example, these comments of mine, under post titled : Virginia Reading Test Scores Plunge, dated Oct. 30, 2019, namely:

      “Reed Fawell 3rd | October 31, 2019 at 11:06 am | Reply

      Here is an important question on this NAEP reading Proficiency Chart that shows that ONLY 33% OF VIRGINIA’S EIGHT GRADERS ARE ABLE TO READ AT OR ABOVE THE NATIONAL 8TH GRADE LEVEL.

      If that is true then why should we believe that its true that 12th grade kids in Virginia pass Virginia’s Standards of Learning (SOL) at far more than double the NAEP rate (at 8th grade), namely:

      “Reading: 78% pass rate, down 2 percentage points from the previous year.

      Writing: 76% pass rate, down 2 percentage points.”

      See: https://www.baconsrebellion.com/latest-sols-more-declines-in-reading-writing/

      In fact, what normally happens after the 8th grade is that disadvantaged kids and other poor learners (whether advantaged or not), fall even further behind their grade level achievement after the 8th grade. This happens for well known reasons. Thus the majority of American kids are no where even close to “college ready” after they “graduate” from 12th grade, assuming they did not drop out altogether from schooling before then.

      In short, what do 12th grade NAEP proficiency charts tell us about Virginia students who graduate? And how do those figures compare to Virginia’s own SOL charts, and what do the latter have to do with telling us about College readiness? Can we believe them? If so, why?

      Reed Fawell 3rd | October 31, 2019 at 1:14 pm | Reply

      “2015 12th graders reading at 12th grade level nationally per NEAP tests – In 2015, thirty-seven percent of twelfth-grade students performed at or above the Proficient achievement level in reading, according to NEAP test results.

      These test results include following percentage breakdowns for students whose parents had variant educational levels:

      18% pass rate for students whose parents did not finish high school.

      24% pass rate for students whose parents did finish high school.

      36% pass rate for those whose parents had some education after high school.

      And AMAZINGLY ONLY 49% PASS RATE for AMERICAN STUDENTS WHOSE PARENTS HAD GRADUATED FROM COLLEGE COULD READ AT 12th GRADE LEVEL.

      What a remarkable record of gross failure. No wonder most kids learn nothing in college. Now, if we compare Virginia students proficiency rates in 12th grade to their grade level, we will see how honest or dishonest Virginia’s SOL testing is. Good luck finding it.

      Now too, we know why 12th grade NEAP testing results are so hard to find, and often are not published at all, including since 2015.”

    2. Reed Fawell 3rd Avatar
      Reed Fawell 3rd

      For an example of the truth instead of state manufactured disinformation (lies) about student K-12 achievement, see:
      https://www.nationsreportcard.gov/reading_math_g12_2015/#reading

  19. James Wyatt Whitehead V Avatar
    James Wyatt Whitehead V

    There are 408 minutes of school time each day at Briar Woods High School in Loudoun County. Ever wonder how much of that time is real instructional time? Lets examine.
    School begins at 9:15.
    Minus 5 minutes to take attendance and perform some administrative duties.
    Minus 10 minutes at end of 1st block for pledge, minute of silence, and school wide announcements.
    Minus 5 minutes for class transition to next period.
    Minus 5 minutes to take roll in 2nd block and perform administrative duties.
    Minus 5 minutes to for transition to 3rd block or lunch shift.
    Minus 30 minutes for lunch.
    Minus 5 minutes transition from lunch back to class.
    Minus 5 minutes to take roll in 4th block and perform administrative duties.
    Minus 5 minutes because no sane teen is going to learn anything after 3:55.
    4:03 bell rings for dismissal.

    75 minutes per day is not instructional time at this high school.
    333 minutes of real instructional time per day. That is assuming everything is perfect and they are rainbows, golden horseshoes, and blue diamonds.

    First month of school mandatory fire drill. Once a week. 15 minutes a shot.
    Every month once a month for the next 9 months. Fire drill. 15 minutes a shot.

    Lock down drill: 20 minutes. 4 times a year.

    Tornado drill: once a year 30 minutes.

    Every Wednesday is Advisory Day. 1 hour is shot. This is used for suicide prevention lessons, bullying lessons, equity lessons, and club days.
    THIS HAPPENS EVERY WEDNESDAY AUGUST TO JUNE. All other classes reduced class time.

    4 times a year: Pep Rally 90 minutes gone per event.

    Don’t forget the School Wide Assemblies that are sprinkled in. 2 hours lost per event.

    Loudoun County frequently closes. 2 hour delays are common. It is not unusual to miss up to 15 days of school. None are made up.

    This single easiest fix to closing all achievement gaps. STOP WASTING INSTRUCTIONAL TIME. Either cut the nonsense out or extend the school day to 5 p.m.

    When I began teaching 27 years ago, a principal would never ever dream up a schedule of wasted time like this.
    https://www.lcps.org/cms/lib/VA01000195/Centricity/Domain/471/BWH%20Bell%20Schedules.pdf

    1. Dick Hall-Sizemore Avatar
      Dick Hall-Sizemore

      You forgot all the standardized and SOL tests. Good points and you probably underestimated transition periods and other interruptions.

      1. James Wyatt Whitehead V Avatar
        James Wyatt Whitehead V

        You are right Mr. Dick. I did forget about those tests. Retired for 16 days now. I have even forget my LCPS password now.
        One of the chief draws to send my 12 year daughter Doodlebug to Randolph Macon Academy was the amount of instructional time.
        I calculated what public schools stated as instructional time. About 1,000 hours.
        Private Schools in Warrenton did a little better: 1,400 hours. It cost you though. 18 grand to as high as 30 grand.
        Randolph Macon Academy: 1,800 hours of instructional time. For 20 grand I thought that was the best bang for the buck. It really showed up in the personal and intellectual growth of Doodlebug. I could not be more pleased with this.

  20. James Wyatt Whitehead V Avatar
    James Wyatt Whitehead V

    There are 408 minutes of school time each day at Briar Woods High School in Loudoun County. Ever wonder how much of that time is real instructional time? Lets examine.
    School begins at 9:15.
    Minus 5 minutes to take attendance and perform some administrative duties.
    Minus 10 minutes at end of 1st block for pledge, minute of silence, and school wide announcements.
    Minus 5 minutes for class transition to next period.
    Minus 5 minutes to take roll in 2nd block and perform administrative duties.
    Minus 5 minutes to for transition to 3rd block or lunch shift.
    Minus 30 minutes for lunch.
    Minus 5 minutes transition from lunch back to class.
    Minus 5 minutes to take roll in 4th block and perform administrative duties.
    Minus 5 minutes because no sane teen is going to learn anything after 3:55.
    4:03 bell rings for dismissal.

    75 minutes per day is not instructional time at this high school.
    333 minutes of real instructional time per day. That is assuming everything is perfect and they are rainbows, golden horseshoes, and blue diamonds.

    First month of school mandatory fire drill. Once a week. 15 minutes a shot.
    Every month once a month for the next 9 months. Fire drill. 15 minutes a shot.

    Lock down drill: 20 minutes. 4 times a year.

    Tornado drill: once a year 30 minutes.

    Every Wednesday is Advisory Day. 1 hour is shot. This is used for suicide prevention lessons, bullying lessons, equity lessons, and club days.
    THIS HAPPENS EVERY WEDNESDAY AUGUST TO JUNE. All other classes reduced class time.

    4 times a year: Pep Rally 90 minutes gone per event.

    Don’t forget the School Wide Assemblies that are sprinkled in. 2 hours lost per event.

    Loudoun County frequently closes. 2 hour delays are common. It is not unusual to miss up to 15 days of school. None are made up.

    This single easiest fix to closing all achievement gaps. STOP WASTING INSTRUCTIONAL TIME. Either cut the nonsense out or extend the school day to 5 p.m.

    When I began teaching 27 years ago, a principal would never ever dream up a schedule of wasted time like this.
    https://www.lcps.org/cms/lib/VA01000195/Centricity/Domain/471/BWH%20Bell%20Schedules.pdf

    1. Dick Hall-Sizemore Avatar
      Dick Hall-Sizemore

      You forgot all the standardized and SOL tests. Good points and you probably underestimated transition periods and other interruptions.

      1. James Wyatt Whitehead V Avatar
        James Wyatt Whitehead V

        You are right Mr. Dick. I did forget about those tests. Retired for 16 days now. I have even forget my LCPS password now.
        One of the chief draws to send my 12 year daughter Doodlebug to Randolph Macon Academy was the amount of instructional time.
        I calculated what public schools stated as instructional time. About 1,000 hours.
        Private Schools in Warrenton did a little better: 1,400 hours. It cost you though. 18 grand to as high as 30 grand.
        Randolph Macon Academy: 1,800 hours of instructional time. For 20 grand I thought that was the best bang for the buck. It really showed up in the personal and intellectual growth of Doodlebug. I could not be more pleased with this.

  21. ksmith8953 Avatar
    ksmith8953

    Keep it simple. It is not about race, it is about the haves and have nots. Poverty is the issue. School is mandatory. If you are a 6th grader and can’t read, guess what, you have to go to school and acting out is a serious option to avoid reading at all.

    1. TooManyTaxes Avatar
      TooManyTaxes

      So why are we importing poverty from other countries through failing to enforce our immigration laws?

    2. ksmith8953 Avatar
      ksmith8953

      Because we are America.

  22. ksmith8953 Avatar
    ksmith8953

    Keep it simple. It is not about race, it is about the haves and have nots. Poverty is the issue. School is mandatory. If you are a 6th grader and can’t read, guess what, you have to go to school and acting out is a serious option to avoid reading at all.

    1. TooManyTaxes Avatar
      TooManyTaxes

      So why are we importing poverty from other countries through failing to enforce our immigration laws?

    2. ksmith8953 Avatar
      ksmith8953

      Because we are America.

Leave a Reply