Enrollment Winners and Losers

by James A. Bacon

The fall 2022-23 enrollment numbers are in for Virginia’s institutions of higher education. Collectively, the state’s public colleges and universities held their own in a year in which enrollment continued to decline nationally. The community colleges staunched their bleeding after a couple of years of severe losses, keeping numbers stable, while the four-year institutions turned in a mixed performance.

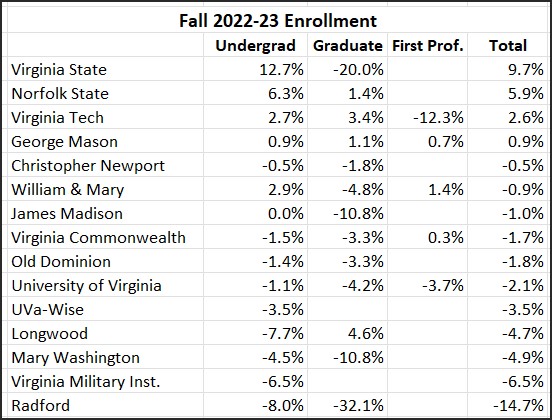
In percentage terms the big winners were Virginia’s two HBCUs (Historically Black Colleges and Universities): Virginia State University with a 9.7% gain, and Norfolk State University, with a 5.9% gain. In absolute numbers Virginia Tech fared best, while George Mason University eked out a modest increase.

All other public institutions lost enrollment, with the most devastating declines taking place at Radford University, down 14.7%, and the Virginia Military Institute, down 6.4%. Small liberal-arts institutions generally fared the worst while big research universities held up better.

There’s more to enrollment numbers than bragging rights. Higher enrollments translate directly into higher revenue. Institutions that lose students also lose revenues, even though their cost structure in terms of departments, programs, and physical plant remains the same. Persistent erosion of enrollment can threaten a university’s financial integrity, as has been seen in innumerable private non-profit institutions across the country that have closed their doors.

The following table shows enrollment broken down by institution, ranked by the percentage gain or loss in the total number of students, including undergraduates, graduate students and “first professionals” such as law school and medical school students. These numbers, published by the State Council of Higher Education for Virginia (SCHEV), may be refined, but they are not likely to change substantially.

While the higher-ed industry nationally is fighting a decline in the number of college-bound students, some institutions are bucking the trend. Each institution has a unique story to tell.

Virginia State is rebounding after experiencing serious financial issues and a previous decline in enrollment.

Virginia State and Norfolk State may be benefiting from an increased interest by African-American students in HCBUs where, in an era of angst over race relations in predominantly White universities, they may enjoy a greater sense of belonging.

Virginia Tech’s numbers may reflect the aggressive expansion of its Northern Virginia campuses.

VMI, as we have documented on this blog, has experienced a massive wave of negative publicity surrounding allegations of racism and sexism, as well as ongoing conflict between the administration and a large portion of the alumni base over the implementation of Diversity, Equity and Inclusion.

Longwood, Mary Washington, Radford, and UVa-Wise are predominantly liberal arts institutions competing for enrollment at a time when more students are seeking to major in disciplines such as business, health, and STEM, which offer superior job prospects upon graduation.

So, how do colleges and universities deal with the enrollment challenge? The admissions process is tricky. The first step is to encourage as many applications as possible from the targeted student demographic. Thanks to the Common College Application process, which makes it easier than ever for college-bound students to apply, the most prestigious institutions have been getting more applications than ever. But some colleges and universities have resorted to dipping deeper into the applicant pool — accepting lower SAT scores and lower high-school grade point averages — in order to maintain their numbers and meet diversity goals.

The challenge is figuring out how many applicants to whom to offer admissions without knowing what percentage will accept. The percentage of students accepting admissions offers is known as “yield.” While students are applying to more colleges, they can attend only one, therefore yields are falling.

Last year Virginia Tech had the experience of admitting more than the number of students it wanted after a higher percentage than expected accepted. That created a problem on the Blacksburg campus of where to house them all. Conversely, if a university offers too few admissions, it can lose revenue for tuition, fees, campus housing, and food services.

Because the admissions process is as much an art as a science, enrollment numbers can blip up and down from year to year. It is important not to read too much into a single year’s change. Boards of Visitors should be looking at five-year (or longer) trends. Are applications up or down? Has the institution resorted to lowering admissions standards in order to maintain its numbers? Is the yield — the rate at which students accept an invitation — up or down?

As SCHEV updates its admissions data and I have more time, I will follow up with more detailed analysis.

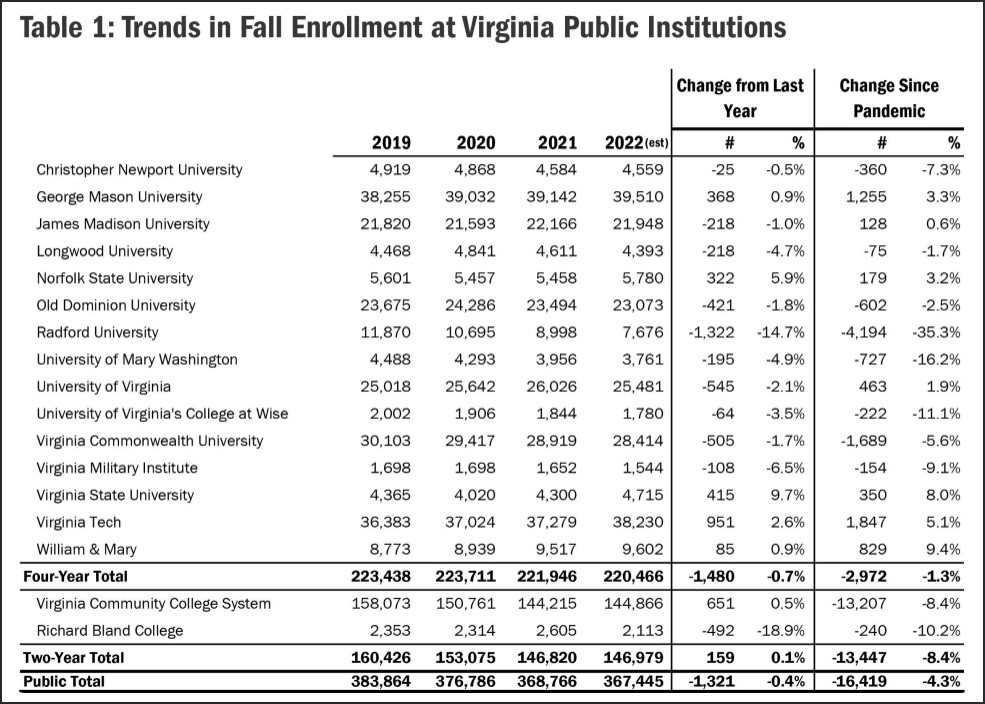
Update: Minutes after I posted this article, SCHEV released its own analysis of enrollment trends. SCHEV looks at the data differently than I have in this post, so the tables are worth reproducing.

First, SCHEV compares pre-pandemic enrollment to post-pandemic enrollment — 2019 versus 2022.

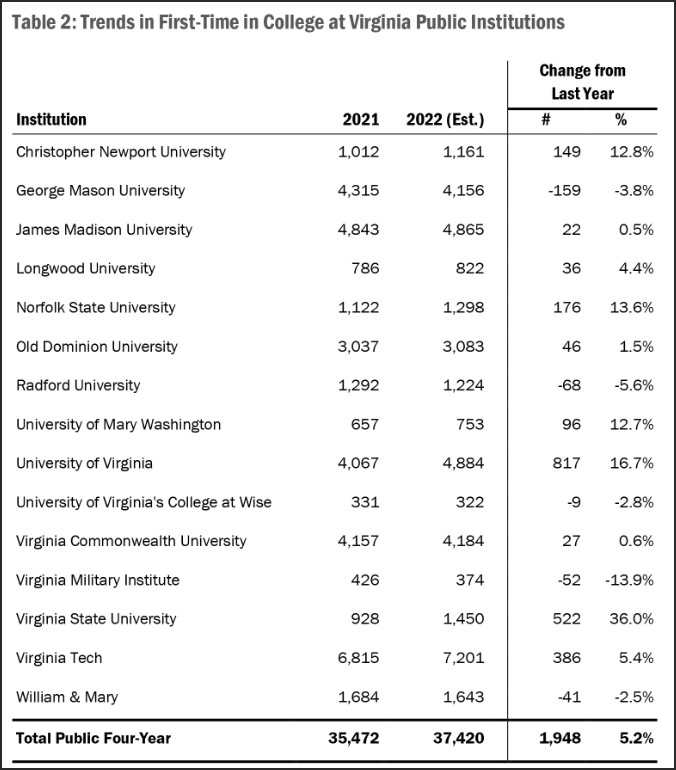
Second, SCHEV breaks out the “first time in college students,” which is a better indication of where things are heading than the total enrollment numbers that I reproduced. Total enrollment of first-time-in-college students surged 5.2% for Virginia’s public four-year institutions, most notably for Virginia State, the University of Virginia, Norfolk State, and Christopher Newport. That’s a very different story — and a more meaningful one — than my analysis above.


Share this article


ADVERTISEMENT

(comments below)


ADVERTISEMENT

(comments below)


Comments

31 responses to “Enrollment Winners and Losers”

  1. LarrytheG Avatar
    LarrytheG

    Sherlock made a comment the other day about how reducing tuition costs for public universities would not be a good thing for the private higher ed.

    And while this post is not about tuition costs, it is about enrollment and I wonder how the smaller, private higher eds are doing and I’d not be surprised that they are slowly being squeezed into fewer and weaker financially – and vicious cycles that leave them with fewer courses and programs and other goodies that young folks like these days.

    1. James C. Sherlock Avatar
      James C. Sherlock

      In a price-driven market like education, the publics are going to win.

      1. M. Purdy Avatar

        I don’t actually think it’s price driven, at least historically. If it were, tuition wouldn’t skyrocket multiple times over inflation for the last 40 years. Mind you, I think consumers are becoming more price conscious as more light is shed on the actual ROI for a 4-year degree. Frankly, I think there are far too many colleges in this country and about a 1/4-1/3 should be shuttered.

        1. James C. Sherlock Avatar
          James C. Sherlock

          They will be. By the 2009 and after baby cliff if nothing else.

          1. M. Purdy Avatar

            Yep, I agree. The demand curve is becoming much more elastic.

      1. LarrytheG Avatar
        LarrytheG

        Of course it’s long on opinion and short on data…. got some data?

  2. James C. Sherlock Avatar
    James C. Sherlock

    Radford is done.

    1. LarrytheG Avatar
      LarrytheG

      Any idea what’s behind the drop?

  3. As a sidebar, I include here one more table. This shows the change in enrollment of in-state versus out-of-state students. While performance varied significantly by individual institution, overall in-state enrollment declined while out-of-state enrollment increased.

    I find it odd that Virginia’s public universities are enrolling fewer in-state students while managing to increase the number of out-of-state students in the face of declining national enrollment numbers. What’s going on here? Are Virginia’s colleges and universities seeking out out-of-state students because they pay much higher out-of-state tuition? Is this trend driven by financial considerations? Or, more pessimistically, are there simply fewer in-state students either applying or capable of doing college-level work?

    Perhaps a clue comes from the fact that the increase in out-of-state students is occurring mainly at the HBCUs, Virginia Tech, and George Mason.

    https://uploads.disquscdn.com/images/9777a6f45204bad3c24fd01484caf4ded2655c263a630fc925941aee2af978f1.jpg

    1. Carmen Villani Jr Avatar
      Carmen Villani Jr

      Follow the money Jim. VMI’s out-of-state fees are nearly twice as much as in-state: $60,396 vs. $30,588
      See: https://www.vmi.edu/about/offices-a-z/financial-aid/tuition-and-fees/

      Additionally, the stated objective of VMI officials is to have a Corps size consist of 55% out-of-state cadets. Wonder how VA taxpayers feel about their tax dollars going to a state college where 55% of the student body is from out-of-state?

      1. M. Purdy Avatar

        If VMI doesn’t have enough in-state demand, why should taxpayers care if there are out of state students making up the difference and paying twice the tuition? I’m not following why this is a problem.

    2. Dick Hall-Sizemore Avatar
      Dick Hall-Sizemore

      What is going on is that out-of-state students are finding that costs in Virginia, even for out-of-state students, are lower than, or comparable to, in-state costs in other states. That is especially true for private schools, such as the University of Richmond.

  4. Carmen Villani Jr Avatar
    Carmen Villani Jr

    Thanks for posting this data Jim. Over the last few weeks, I have been compiling my own enrollment data. Having earned a BS in mathematics from VMI, I enjoy working with numbers. The challenge with doing the analysis has been the ability to do an apples-to-apples comparison. If anyone is interested in reviewing that analysis, they can go to the following link.
    https://docs.google.com/presentation/d/1ffadLroBUMbh0xMZYf69GEEvAYLA3H1t/edit?usp=sharing&ouid=113706272223145929068&rtpof=true&sd=true

    Even with the data you provided here, it is inconsistent with the data on the VMI dashboard. For instance, if you look at the VMI number in the “Table 2” chart that you posted, it lists the 2021 number as 426 and 374 for this year. 374 is an interesting number in that on Matriculation Day, the Superintendent gave a number of 372 and the official press release by VMI is 375. https://vmi.edu/news/headlines/2022-2023/vmi-welcomes-new-cadets-at-matriculation.php The 374 number is a matriculation number. The 426 isn’t. Even reviewing VMI’s Common Data Set data, the numbers don’t always add up. Another example is the estimated enrollment number of 1544 in Table 1. At a recent VMI Board of Visitors’ meeting, the enrollment number presented was 1532. This is not to suggest there is a “cooking of the books” going on but merely to illustrate the challenges in doing and apples-to-apples comparison of data.

    In reviewing the VMI data dashboard, the “enrollment number,” which can be lower than the matriculation number, is listed as 494, not 426. During the 2021 Matriculation Ceremony, the Superintendent stated that the matriculation number was expected to be 496. Using the 494 number and 375 (VMI numbers), the drop in enrollment year-over-year is 24.1%. When comparing it to the highest matriculation number of 519 (fall of 2020) since 2010, the percentage goes to 27.7%. The fall of 2020 was during COVID and BEFORE the onslaught of accusations of VMI being a racist and sexist college could have an impact.

    A few other points to make here. The first is that prior to the media blitz and the infamous letter coming from the former governor and 10 other Democrats dated October 19, 2020 making serious allegations that VMI was a racist and sexist college, VMI had an average enrollment of 507 going back to 2010, which met an earlier goal of 500+. Secondly, the push to implement Diversity, Inclusion, Equity (DIE) had yet to take hold so anyone attempting to make the argument that VMI’s abysmal low matriculation number this year is the result of not implementing DIE sooner is ignoring the data. The third point, if anyone attempts to state that the military academies or other schools looked at in my analysis doesn’t apply, I would refer that person to what the Superintendent stated in his September 1, 2022 letter. He provides as one of the reasons for the decline in “this year’s class size” as a “declining trend in the number of students attending college.” Note that there is no specificity when referring to colleges. To merely suggest that all the negative media and DIE initiatives that have taken place over the last two years is mere coincidence and not a contributing factor to the low matriculation number is ignoring the data.

    1. M. Purdy Avatar

      Aren’t you on record saying that DEI implementation is a causal factor in enrollment decline at VMI?

      1. Carmen Villani Jr Avatar
        Carmen Villani Jr

        Suggest reading the last sentence again. Believe it states that the data supports such a conclusion.

        1. keydet16 Avatar

          I posted this in another thread sometime ago, but I’ll repost it here:

          I think low enrollment numbers can be expected at the ‘I’ for the next few years. VMI, despite what folks here might say isn’t really ‘woke’, but, it is also not really a revanchist conservative college either. As a result, it doesn’t really appeal to conservative families in the Chesterfield, SWVA, Orange county, etc., but it also doesn’t appeal to uber-progressive families in NOVA either.

          And of course, the incessant and borderline slanderous reporting from Ian doesn’t help.

          I suspect that the enrollment numbers will pick up around the ’24-’25 academic year.

          1. Carmen Villani Jr Avatar
            Carmen Villani Jr

            I think we can all agree that there are a number of different factors involved.

          2. M. Purdy Avatar

            Why do you go on the radio and attack LTC Love and accuse VMI of teaching CRT if there are “a number of different factors involved”? That seems highly irresponsible if you’re now claiming that there are multiple factors.

          3. M. Purdy Avatar

            Why do you go on the radio and attack LTC Love and accuse VMI of teaching CRT if there are “a number of different factors involved”? That seems highly irresponsible if you’re now claiming that there are multiple factors.

        2. M. Purdy Avatar

          Oh, so DEI implementation caused the decline. Even military though schools with DEI fared much better, including The Citadel. Tell me, Mr. Mathematics BS, how does that make sense?

          1. Carmen Villani Jr Avatar
            Carmen Villani Jr

            You really need to take the time to read what I am saying Michael. I have clearly stated that there are multiple factors involved, not just DIE implementation. Your continued personal attacks serve no useful purpose and only brings discredit to yourself and the Institute.

          2. M. Purdy Avatar

            I did read your tiresome post. I’m asking if you’re on the record for saying that it’s DEI that caused the downturn in admissions. To borrow your phrase, you really need to discern what I’m asking you. I’m pretty sure you went on the radio (and BR) and claimed that it was DEI implementation that led to the downturn in enrollment. Am I mistaken? And I’m not personally attacking you. You should be less thin-skinned. You went to VMI, right?

          3. Carmen Villani Jr Avatar
            Carmen Villani Jr

            You don’t get it Michael. Someday, I hope that you will.

          4. M. Purdy Avatar

            Carmen, are you unable to answer a simple question? Did you or did you not go on the radio and BR and say that DEI was causing the downturn in enrollment? Why are you deflecting? C’mon, as a man of honor, you need to come clean.

  5. Nancy Naive Avatar
    Nancy Naive

    Of course, we could ask the experts…
    https://www.bls.gov/news.release/hsgec.nr0.htm

  6. Nancy Naive Avatar
    Nancy Naive

    Jobs are plentiful. That almost always results in decreases in graduate program enrollment. Probably has an effect on undergrads too.

    https://www.insidehighered.com/sites/default/server_files/media/2015-08-25%20CC%20enrollments%20and%20UE%20rate2.jpg

    One college’s experiences, prepandemic
    https://iushorizon.com/22822/news/a-look-at-the-correlation-between-enrollment-and-unemployment/

  7. Dick Hall-Sizemore Avatar
    Dick Hall-Sizemore

    An extension of the time line back to 2017, in order to get a five-year trend, confirms that the trend in the table shown in Jim’s article is, with a couple of exceptions, a continuation of a longer term trend. The enrollments at Radford, Longwood, and Mary Washington have declined each year since 2017. That trend also was applicable to Norfolk State and Virginia State until this year’s surge in enrollment in those two schools. We will have to wait until next year to see if this increase is sustainable or is just a blip.

    The relative stability in enrollment overall masks some internal dynamics. Over the last couple of years, applications have increased significantly. However, that increase was not distributed evenly. For some schools, the number of applications has been declining, while surging for others.

    At some point, some strategic discussions and decisions will need to be made. Does the Commonwealth continue to provide operating and capital funding for schools whose enrollments continue to decline? Should something be done to bolster the attractiveness of those schools? If so, what? Or, should there be some consolidation? Who gets closed?

    On the other hand, should some schools be expanded to accommodate the increases in applications? Who gets more dorms and faculty? Of course, not everyone may want to grow. For many years, William and Mary has resisted pressure to increase the size of its student body. Because it is operating at full capacity and receives more than enough applications each year to fill its incoming freshman class, SCHEV’s data will show very little change in W&M’s enrollment from year to year.

    1. At some point, some strategic discussions and decisions will need to be made. Does the Commonwealth continue to provide operating and capital funding for schoo ls whose enrollments continue to decline? Should something be done to bolster the attractiveness of those schools? If so, what? Or, should there be some consolidation? Who gets closed?

      I agree totally. Legislators face hard choices ahead. One thing you can count on: the response will be based on political considerations far more than economic ones.

    2. LarrytheG Avatar
      LarrytheG

      One might ask if there are folks at each school that work to know what things make them a more appealing choice.

      JAB tends to paint them all in similar terms that they are not concerned about costs and tenure and other things but perhaps some of them actually are pretty good at figuring out what programs and amenities attract enrollment better than their peers.

      And perhaps larger schools with more resources have more ability to invest in things that attract more “customers”.

      There may actually be a “market” in terms of winners and losers that is related to how they run their schools.

Leave a Reply