
by Matt Hurt
Since the Region VII superintendents initiated the Comprehensive Instructional Program in 2014, we have annually identified our top five most successful teachers of our most at-risk students in each SOL-tested course. In their classes, at least 50 percent of students were economically disadvantaged, and they also had a significant number of students with disabilities. Despite that, their SOL pass rates were very high, even higher than many teachers’ pass rates who had few economically disadvantaged students and no students with disabilities. When asked, all of these teachers have conveyed a common theme: they expected their students to pass the SOL test, and the teacher believed it was his/her job to ensure that happened.
Similarly, we find the theme of high expectations rampant in our most successful schools and divisions in our high poverty areas. For example, Wise County and Norton City were the two divisions that outperformed the relationship between poverty rates and SOL performance in 2022 (as well as several years prior). This relationship accounted for 30 percent of the variation in overall SOL scores among all 132 divisions that year. The poverty rate in these two divisions is greater than approximately 90 percent of other school divisions in the state, and they are also typically the least-well-funded two divisions in Virginia when considering overall per-pupil funding. Despite those challenges, these two divisions outperformed 95 percent of all other divisions in 2022.
Figure 1
2022 Overall Division Pass Rates Compared to Federal Poverty Rates
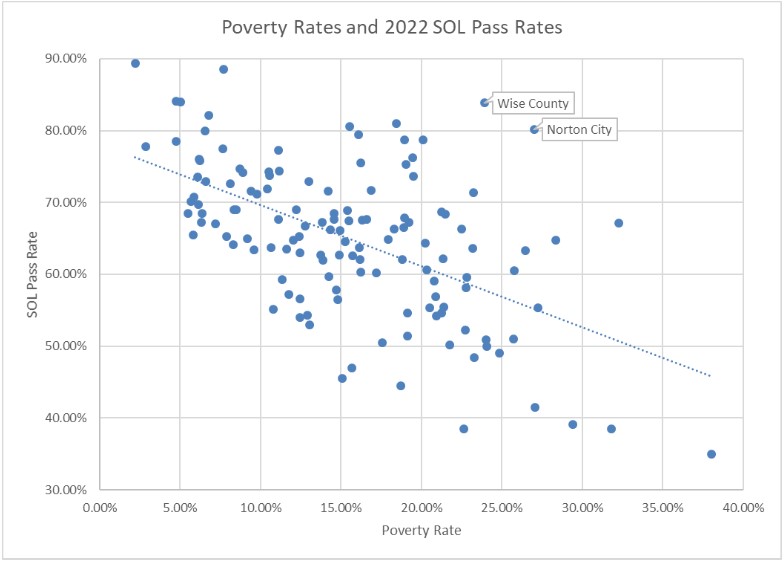
One of the secrets to success in Wise County and Norton City is that they have very high expectations. The teachers expect their kids to be successful on their SOL tests. If at any time throughout the year a student demonstrates he or she is unlikely to be successful, the teacher provides that student extra instruction outside of class time to fix the problem. The administrators expect their students and teachers will be successful, and they take great pains to ensure that happens. Teachers are empowered to make instructional decisions they believe will help their students be more successful. Teachers and administrators are also held accountable, as student outcomes (such as SOL pass rates) are included in their evaluation goals and account for a very significant part of their summative evaluations.
We have found that expectations vary wildly among classrooms, schools, and divisions. If we were to poll educators across the state and ask what are their expectations (high, moderate, or low), it is extremely likely that the vast majority of respondents would answer “high”. It is very evident that not all educators have the same definition of “high” in this context.
Since expectations are a relatively intangible concept, we decided that we needed to make this more concrete. Through working with teachers and administrators over the years, we came upon the idea of comparing final course grades of our students to their SOL test score that is associated with that course. Generally, a student’s final grade for the course is a measure of how that student performed relative to the teacher’s expectation. Similarly, the student’s SOL score is a measure of the student’s performance relative to the state’s expectations. The initial hypothesis was that the closer final grades aligned to SOL proficiency, the higher the SOL pass rates would be.
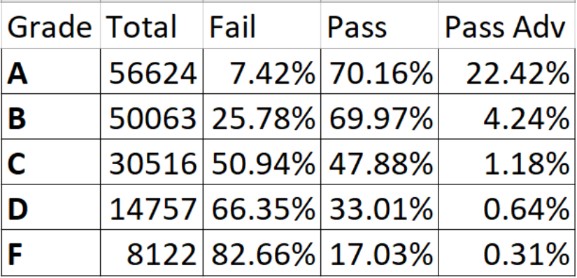
We initially tested this hypothesis in 2019 by analyzing the data of 35 public school divisions and followed that with an analysis of data from 43 divisions in 2022. Table 1 illustrates the distributions of final course grades among these 43 divisions in 2022. These data indicate that there was a significant gap between educator expectations and the expectations set forth by the state.
Table 1
Distribution of Final Grades and SOL Proficiencies among 43 School Divisions in 2022
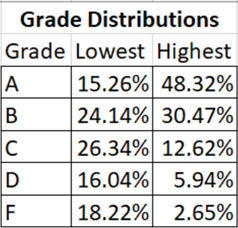
To illustrate the range of distributions, Table 2 displays the distributions of final course grades and SOL proficiencies for the highest and lowest performing divisions in this data set. In the lowest performing division, almost one-fourth of the students who earned an A for the course failed the SOL test associated with that course, compared to less than two percent in the highest performing division. The fact that the final grade of “A” constituted significantly less of the lowest performing division’s data (Table 3) indicates that this problem is likely more significant.
Table 2
Distribution of Final Grades and SOL Proficiencies for the Highest and Lowest Performing Divisions in 2022 Among the 43 School Divisions in this Data Set
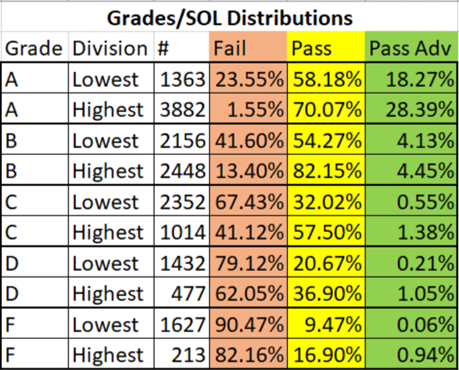
Table 3
Distribution of Final Grades for the Highest and Lowest Performing Divisions in 2022 Among the 43 School Divisions in this Data Set
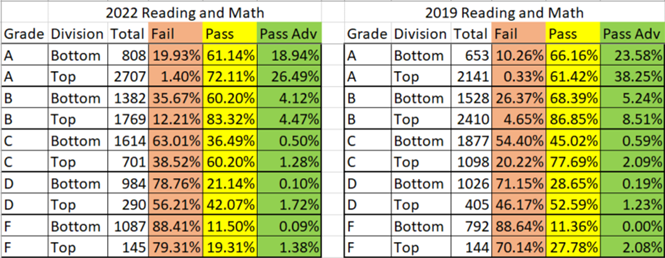
During the initial analysis of the data in 2019, persistent alignment problems were identified, but not to the same degree as we realized in 2022. Table 4 below illustrates how the alignment of expectations significantly shifted negatively from 2019 to 2022. It is extremely likely that a number of issues associated with our educational response to the COVID-9 pandemic caused these statistics to skew negatively.
Table 4
Distribution of Final Grades for the Highest and Lowest Performing Divisions in 2019 and 2022
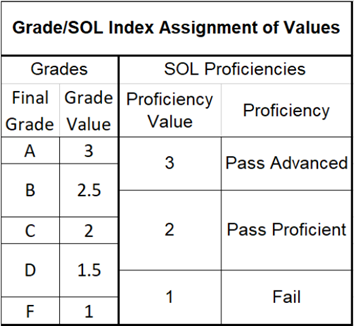
To conduct the statistical analysis of this data set, the SOL score of each student was matched with the final course grade associated with that SOL test. The alpha values for grades and SOL proficiencies were re-coded to numeric values (see Table 5) very intentionally for two reasons.
Traditional assumptions of the level of performance:
— Grades that represent A’s and high B’s have traditionally been considered advanced grades.
— Any score on the SOL test above 499 is by definition an advanced score.
— C’s have been considered dead average. The average student SOL score among our data set was significantly above 400 (passing).
— The lowest passing grade on the 10 point grading scale is a 60%, and the lowest passing score on the SOL test is a 400.
Grade/SOL proficiency distributions of our most successful teachers of our most at-risk students:
— Their students who earn A’s and B’s for the course either score pass advanced or pass proficient on the SOL test.
— All of the students who earn C’s typically pass their SOL test.
— Sometimes a student who earns a D will pass the SOL test, and sometimes will fail.
Table 5
Conversion of Alpha Values for Grades/SOL Proficiencies to Numeric Values
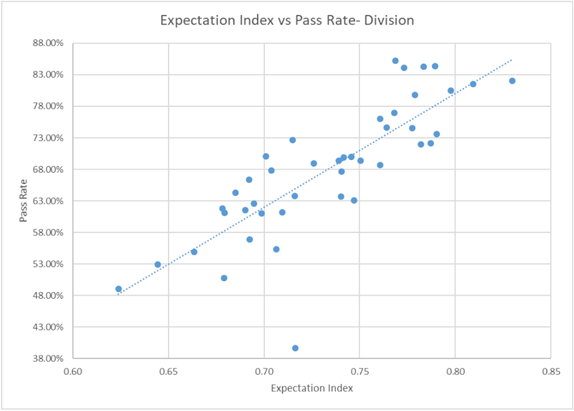
Once the data were re-coded, we calculated what we termed the “Expectation Index.” To do this, we divide the sum of the SOL proficiency values by the sum of the sum of the grade values at the division, the school, and the teacher level. Theoretically, the closer the Expectation Index value is to one, the more aligned the expectations are to those of the state.
Figure 2 demonstrates the relationship between the division Expectation Index and pass rates in 2022. Among these 43 divisions, the Expectation Index explained 65 percent of the variation in SOL pass rates. If the single outlier division at the bottom of the distribution were removed from that calculation, the Expectation Index would explain 75 percent of the variation among the remaining 42 divisions.
Figure 2
Relationship Between Division Expectation Index and SOL Pass Rates
It is important to note that it is not reasonable to strive for perfect alignment of final course grades and SOL proficiencies. Our teachers are not issued standardized students, nor are our principals issued standardized teachers. There are so many human variables in the mix that one would be driven mad trying to ensure perfect alignment. However, when we exhibit significant numbers of kids who earn A’s, B’s, or C’s who fail their SOL tests, we have a major problem that negatively impacts our students.
It is also important to consider the various factors that go into grading. For example, most teachers do not like conflict and will go to certain ends to avoid it. Parents and administrators do not like to see low grades, and sometimes that may encourage padding grades or creative weighting of grades to avoid potential conflicts.
Policies also impact grading outcomes. Some school boards and a number of administrators have mandated that teachers record no grade below 50 in their grade books. In divisions on a 10-point grading scale, if 50 is the lowest possible grade, a student doesn’t have to engage at all with the content in order to pass the class. Not only does this policy affect the alignment of grades and SOL proficiencies, it also dis-incentivizes student effort.
Similarly, in many of the Individual Education Plans (IEPs) of students with disabilities, accommodations are written that require students to complete only 50 percent of each assignment. Most teachers require students to do only the amount of work necessary to master the skills they are expected to teach. Therefore, it is unrealistic for a student with a disability to master grade level skills if they’re not expected to do enough work to be successful. If anything, a student with disabilities should be provided additional support and opportunities to engage with the content. In our schools that have mitigated the gaps between their students with disabilities and their non-disabled students, that’s exactly what they do — provide more for those students, not expect less.
The correlations between the Expectation Index and SOL pass rates has been the most significant factor that we have studied. The table below demonstrates a number of factors that we found had a significant effect on the SOL pass rates of public school divisions in 2022. The statistics associated with the Expectation Index come from those 43 divisions that participated in our study, and the other statistics were derived from the data of all 132 public school divisions in Virginia. All of those factors except for the Expectation Index are outside of the control of our educators.
Table 6
Relationships Between Various Factors and Division SOL Pass Rates in 2022

It is extremely encouraging to demonstrate that the efforts of educators matter more with regard to student outcomes than factors educators can’t control!
Matt Hurt is the director of the Comprehensive Instructional Program, a consortium in which teachers and administrators from forty-nine public school divisions in Virginia collaborate to ensure better educational outcomes for their students.
Leave a Reply
You must be logged in to post a comment.