Data of the Day: 5-Year Enrollment Trends

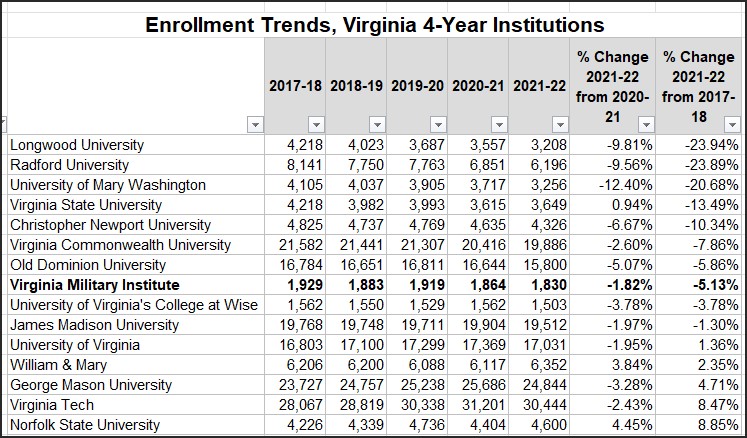
A week ago I published data showing the winners and losers among public Virginia four-year colleges and universities in the enrollment sweepstakes for the 2022-23 academic year. Larry Houseworth, a Virginia Military Institute alumnus, has shared the table above showing the five-year record. For most institutions, declining/increasing enrollment this year represents a continuation of trends evident for several years.

An exception is VMI, where the trend had been stable through 2019-20, then started sinking after the military academy was vilified as systemically sexist and racist not only by The Washington Post (what else do you expect?) but by one of its more prominent alumni, then-Governor Ralph Northam, and his hand-picked “independent” investigators.

— JAB


Share this article


ADVERTISEMENT

(comments below)


ADVERTISEMENT

(comments below)


Comments

10 responses to “Data of the Day: 5-Year Enrollment Trends”

  1. Nancy Naive Avatar
    Nancy Naive

    One of my daughter’s favorite books when we read her to sleep was “Why Benny Barks”. BR opines on barking dogs.

  2. Eric the half a troll Avatar
    Eric the half a troll

    Isn’t 1929 to 1883 a decrease…?

  3. Richard Genetalia Avatar
    Richard Genetalia

    A much more dramatic decline is noted in new enrollments. I feel this chart is somewhat misleading for VMI, as the rat mass of 21+3 was the largest ever at the Institute; the two subsequent rat masses, after the unnecessary changes designed to mask the personal failings of the former governor, were down versus that year by 6% and 29% respectively. Draw your own conclusions.

  4. M. Purdy Avatar

    Can someone explain to me what I’m supposed to be looking at? GMU and JMU both look to be steady too, with a big drop in 2022.

  5. Carmen Villani Jr Avatar
    Carmen Villani Jr

    I am not sure as to what is the source of the data. The best I can determine, it is SCHEV FTE Enrollment data. The SCHEV website defines FTE as: “Annual Full-time Equivalent (FTE) is a standardized measure of enrollment that converts part-time student activity to equivalents of full-time student activity. There are a variety of formulas used in higher education, however the standard used by SCHEV is {total credits}/30 for undergraduate and professional students and {total credits)/24 for graduate students.”
    See: https://research.schev.edu/info/Reports/Guide-to-the-Enrollment—Annual-FTE-Reports

    However, the numbers are inconsistent with what I was able to find making the percentages quite different than what I calculated. All the VMI numbers matched up but the others did not. The “Enrollment Trend” data on the VMI website also has different numbers. I believe a more accurate apples to apples comparison would be “Fall enrollment” numbers. Below is a chart that I created that reflect the FTE, Undergraduate, and Total enrollment numbers that I found on the SCHEV website. If you click on the picture, it will expand for easier viewing. When taking into consideration total enrollment at schools such as Longwood, the percentages change.

    https://research.schev.edu//enrollment/E5T6_Report.asp

    https://research.schev.edu/Institutions

    Also, this analysis fails to recognize what happened with enrollment this year at VMI. I have already given my perspective as to why, so I will not repeat it here but leave it up to the reader to make their own determination. Year-over-year total enrollment (1652 vs 1532) decreased 7.3%; year-over-year Rat enrollment (494 vs 375) decreased 24.1%; when compared to the highest enrollment since 2010 (fall of 2020 519 vs. 375), that is a 27.7% decrease; going back to the fall of 2010, the largest decrease was a mere 4.8% (519 vs. 494).

  6. Carmen Villani Jr Avatar
    Carmen Villani Jr

    https://uploads.disquscdn.com/images/912d1a923adfa66b45b1bf562b101e7a6ceff90cb693f1488ede7f2b552f0cfd.png

    I am not sure as to what is the source of the data table posted Jim. The best I can determine, it is SCHEV FTE Enrollment data. The SCHEV website defines FTE as: “Annual Full-time Equivalent (FTE) is a standardized measure of enrollment that converts part-time student activity to equivalents of full-time student activity. There are a variety of formulas used in higher education, however the standard used by SCHEV is {total credits}/30 for undergraduate and professional students and {total credits)/24 for graduate students.”
    See: https://research.schev.edu/info/Reports/Guide-to-the-Enrollment—Annual-FTE-Reports

    However, the numbers are inconsistent with what I was able to find making the percentages quite different than what I calculated. All the VMI numbers matched up but the others did not. The “Enrollment Trend” data on the VMI website also has different numbers. I believe a more accurate apples to apples comparison would be “Fall enrollment” numbers. Included is a chart that I created that reflects the FTE, Undergraduate, and Total enrollment numbers that I found on the SCHEV website. If you click on the picture, it will expand for easier viewing. When taking into consideration total enrollment at schools, such as Longwood, the percentages change.

    https://research.schev.edu//enrollment/E5T6_Report.asp

    https://research.schev.edu/Institutions

    Also, this analysis fails to recognize what happened with enrollment this year at VMI. I have already given my perspective in a previous post as to why, so I will not repeat it here but leave it up to the reader to make their own determination. Year-over-year total enrollment (1652 vs 1532) decreased 7.3%; year-over-year; year-over-year Rat enrollment (494 vs 375) decreased 24.1%; when compared to the highest enrollment since 2010 (fall of 2020 519 vs. 375), that is a 27.7% decrease; going back to the fall of 2010, the largest decrease was a mere 4.8% (519 vs. 494).

    1. LarrytheG Avatar

      re: ” I am not sure as to what is the source of the data table posted Jim. ”

      Yep. Always a reason to not get carried away
      with the numbers.

  7. owen dunlap Avatar
    owen dunlap

    Regarding the VMI numbers – i feel this is much ado about nothing– this is a easy “fix” if the trend continues – just lower the academic standards for acceptance. The system is the important part of VMI ( ratline/class system/honor system being 3 important features of many) – not necessarily a high caliber of academic success in high school of the rat class. I’m not sure on this – but it my feeling that the academic standards have gone up in recent years. Obviously keeping the “numbers” at a certain level is important for both financial reasons and for maintaining another minor but important part of the “system” – the high number of roommates you have and bond with living in such tight quarters ( especially as rats where you are randomly assigned). I think any VMI alumni would easily be able to list Brother Rats who struggled academically at VMI ( note- i have used spell check about 10 times writing this ) and have gone on to success in life and are good examples of men and women in their communities. VMI needs to focus on the keys system and its mission of producing ” citizen soldiers” for Virginia and our country and not spend time wringing hands about charts and numbers – if the trend continues downward – lower acceptance standards to get them back up to where they are needed There will always be demand for a great school and system, and high school academic success is pretty low on my list of what makes VMI work and VMI the great school it is.

    1. Richard Genetalia Avatar
      Richard Genetalia

      Wow.

      1. owen dunlap Avatar
        owen dunlap

        with reflection – i suppose that cutting tuition and/or offering more scholarships of all types is another and better solution if the numbers continue to trend down over time – my point is there are solutions like those ( and doing more nationwide marketing ) available – and we have leadership at VMI that will monitor and adjust as needed. We had a one year drop in the rat class — there seems to be a lot of alumni and others using that one year drop in the rat class to support or argue different issues – my point is if the trend continues – there are solutions available to try

Leave a Reply