COVID and the Racial Achievement Gap

by James A. Bacon

Two weeks ago, before I so rudely interrupted myself by taking a vacation in North Carolina, I was engaged in an analysis of the latest Standards of Learning (SOL) test scores. As measured by pass rates, Virginia students statewide recovered much, but not all, of the ground they had lost during the disastrous 2020-21 school year of COVID-driven school closures. However, I showed there was considerable variability between school districts. Some some districts rebounded so smartly that pass rates last year (2021-22) exceeded those of the pre-COVID year of 2018-19. Others showed minimal recovery.

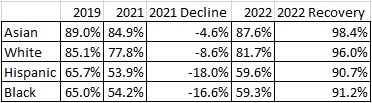
Today, I’ll drill into the data to examine the role of economic disadvantage and race. Rather than explore the “Black/White” divide in scores, as is customary among those who wish to perpetuate the idea of “systemic racism,” I present  data using Asians as the benchmark of performance, compared to whom all other groups — Whites, Blacks, and Hispanics most prominently — fall short.

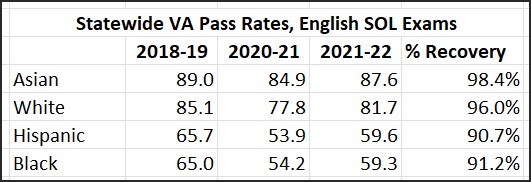
In the table above we can see that 87.6% of students classified as Asian passed their English SOL tests last year, bringing them back to 98.4% of the pre-COVID norm. Whites recovered to a lesser degree, and Hispanics and Blacks an even lesser degree. Comparing the post-COVID year with the pre-COVID year, the racial achievement gap got worse.

It is widely accepted that the shift from in-person to hybrid and remote learning during the height of the COVID pandemic in 2020-21 is largely to blame for the plunge in pass rates across all districts, racial/ethnic groups and socioeconomic classes. However, the variability in performance after everyone returned to school is harder to explain.

It is common wisdom that economically disadvantaged students had the toughest time during the pandemic. They were less likely to have access to laptops and the Internet, and parents were less able to rearrange their lives to spend time at home and supervise their activity. As can be seen in the table below, the decline in SOL pass rates among non-economically disadvantaged students (with family incomes too high to qualify for free and subsidized lunches) were modest during the pandemic year, and have come close to passing at the same rate as in the pre-pandemic year.

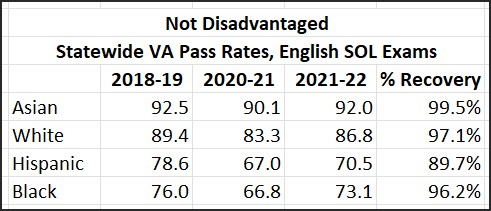
The outliers among non-disadvantaged students are the non-disadvantaged Hispanic students. They dropped the most during the pandemic year, and they have recovered the least. There is something distinctive about non-disadvantaged Hispanics — perhaps their higher likelihood to be English language learners — that calls out for explanation. It is worth a follow-up look at the statistics.

The table below shows the English SOL pass rates for economically disadvantaged students broken down by race/ethnicity.

Pass rates declined significantly among all race/ethnicities — much more than for the non-disadvantaged students. That seems to confirm the idea that socio-economic status was a major factor in declining pass rates — poor households were less able to adapt to the challenges of remote learning than well-to-do households.

But race/ethnicity is also a factor. Remember, all the students in this table are economically disadvantaged. Pass rates during the pandemic year dropped by 9 to 12 percentage points for all groups, but Asians have rebounded significantly more than Whites, who in turn recovered more than Hispanics and Blacks. In other words, socioeconomic status goes only so far in explaining last year’s SOL results.

One possible explanation would blame systemic racism. From curricula to behavioral expectations, according to the woke school of thought, the educational system was designed by Whites for Whites. Proponents of this explanation have to explain, however, why Asians consistently out-perform Whites in a system supposedly dominated by Whiteness. Labeling Asians “White adjacent” is not an explanation. Another weakness is that, while this explanation conceivably explains the differences in pre-pandemic pass rates, it cannot explain why the post-pandemic rebound has been slower for Blacks and Hispanics. The past three or four years have seen the widespread implementation of “anti-racist” policies at every level. If structural racism were the problem, Blacks and Hispanics should be catching up. They’re not. The gap is getting wider.

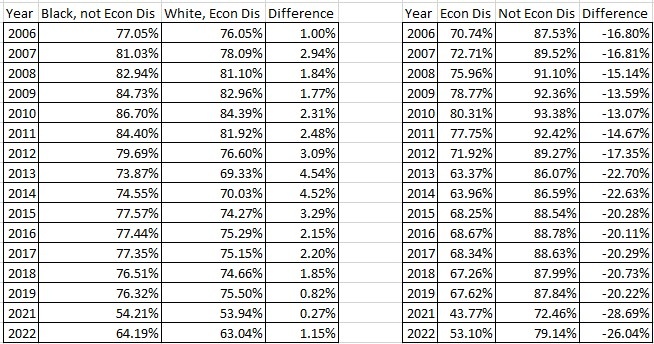
The following tables show the racial gaps in SOL pass rates (using Asians as the benchmark) for economically advantaged and disadvantaged students.


The gap between Asians on the one hand and Whites, Hispanics and Blacks on the other hand widened for both advantaged and disadvantaged alike.

Alternate explanations of this divergence are called for. One approach would be to focus on how well different school districts managed the challenges of the COVID shutdown and its aftermath. Perhaps some school districts are more politically dysfunctional than others. Perhaps some have superior philosophies.

As time permits, I will explore that topic in future posts.


Share this article


ADVERTISEMENT

(comments below)


ADVERTISEMENT

(comments below)


Comments

16 responses to “COVID and the Racial Achievement Gap”

  1. How about the data comparison of a two-parent family vs. a single parent? Or do we not want to know this metric?

    1. Dick Hall-Sizemore Avatar
      Dick Hall-Sizemore

      That would be a worthwhile comparison. However, I doubt the data is available that would enable it to be done.

  2. Dick Hall-Sizemore Avatar
    Dick Hall-Sizemore

    Thanks for this analysis, Jim. The recovery rates are better than I had expected, given all the wailing and gnashing of teeth there has been concerning the damage inflicted as a result of school closures. What is worrying is that, because the recovery rates for Blacks and Hispanics lagged behind those of Whites and Asians, the achievement gaps have increased. Obviously, the Commonwealth needs to find a way to improve the achievement of the disadvantaged.

    1. Nancy Naive Avatar
      Nancy Naive

      Yes, by 2 points or so. Is it significant? Is it permanent? It’ll take more than just the one year to know.

      COVID itself was more devastating to those two groups. Death has a negative impact for awhile.

      1. I’d always heard that death has a permanent negative impact…

        😉

  3. Eric the half a troll Avatar
    Eric the half a troll

    “The past three or four years have seen the widespread implementation of “anti-racist” policies at every level. If structural racism were the problem, Blacks and Hispanics should be catching up. They’re not. The gap is getting wider.”

    Or had those programs not been in place the gaps could have increased even more. Your logic is not sound here…

    1. Stephen Haner Avatar
      Stephen Haner

      Logic? First you need actually data before you waste your time on logic. And before that you need to actually inspect the data you have (as in, hey Nancy, wanna look at the death rate for Hispanics again? Surprise! Less than half the number of deaths per 100K than black or white, which BTW are damn close to each other, closer than probably even you realize.)

    2. Matt Hurt Avatar

      Here’s something to chew on. The table below displays the gap between Black students who were not economically disadvantaged versus White students who were economically disadvantaged across all tested areas. When we control for economically disadvantaged status, the picture gets even worse. As you can see, we have a gap of -26 points between our Economically Disadvantaged students and our Not Economically Disadvantaged students. However, our Black Not Economically Disadvantaged students barely outperform our White Economically Disadvantaged Students. I can’t see how the recent programs have really helped anything. In fact, there was a negative trend there in recent years. It seems to me that things are worse than a lot of folks realize.

      https://uploads.disquscdn.com/images/857758f0984d4893155dba98916f30c281eef4a35eec09ae849d5ebcac7eb6c7.jpg

    3. Matt Hurt Avatar

      Here’s something to chew on. The table below displays the gap between Black students who were not economically disadvantaged versus White students who were economically disadvantaged across all tested areas. When we control for economically disadvantaged status, the picture gets even worse. As you can see, we have a gap of -26 points between our Economically Disadvantaged students and our Not Economically Disadvantaged Students. However, our Black Not Economically Disadvantaged Students barely outperform our White Economically Disadvantaged Students. I can’t see how the recent programs have really helped anything. In fact, there was a negative trend there in recent years. It seems to me that things are worse than a lot of folks realize.

      https://uploads.disquscdn.com/images/857758f0984d4893155dba98916f30c281eef4a35eec09ae849d5ebcac7eb6c7.jpg

      1. Dick Hall-Sizemore Avatar
        Dick Hall-Sizemore

        Fascinating insight! The Black Not Ed barely outperforming White ED. How does Jim and others explain that?

        1. LarrytheG Avatar

          It depends a lot what schools they attend. In schools which serve economically disadvantaged neighborhoods where the majority of the kids are ED – the non ED kids get the standard curriculum.

          Conversely if you send that same kid to a high performing school where they are challenged with the higher level curriculum – the same kid will do better.

          Matt talks about the “expectations” that are school-dependent. Mr. Whitehead has talked along the same lines, that a lot depends on the Principal and school “culture” and climate.

          The thing that amazes me is that this does not sound like an institutional process but rather luck of the draw.

  4. Matt Hurt Avatar

    We cannot directly compare Reading pass rates from 2019 to any year thereafter due to the Board of Education significantly lowering the cut scores for pass proficient in 2021. In other words, it was much easier to pass a Reading SOL test after 2019 than before. Had they not done that, the scores would be even lower than they currently are, so that act really masks the actually lower recovery than the data currently indicate.
    https://uploads.disquscdn.com/images/579144bc944f6c62b1f163055cb49d433404eabf48fee288e1c3fd7baac6c394.jpg

    To discuss the 2022 outcomes, it is also important to examine the 2021 outcomes. As you can see from the table below, Hispanic and Black students suffered more significant declines in 2021 than Asian or White students. Therefore, they had much more ground to make up. This suggests that it is reasonable (although certainly not desirable) that their recovery to 2022 would be less than the other groups.
    https://uploads.disquscdn.com/images/8edb377ae97204cbbbe21e787ee3b26f7d1cd43262b6857317cf74cbab07d324.jpg

    As far as the lag of Black students in particular, they were offered significantly less in-person instruction in 2021 than White students across the state. This was simply a function of the decisions of local health district and division school boards and the demographics of those localities. We have not conducted an analysis of the Hispanic students and the degree to which they were allowed in school in 2021, but I suspect that it would not be as much as White students based on the demographics of the different regions.
    https://uploads.disquscdn.com/images/0c77b0b4f2803f2dec10935cffa55f228626a440472ef0fd07ab68d0375b536a.jpg

    1. LarrytheG Avatar

      Playing with data has pitfalls as Matt illustrates.

      JAB starts like this: Rather than explore the “Black/White” divide in scores, as is customary among those who wish to perpetuate the idea of “systemic racism,” then proceeds to do just that – again.

      Here’s the truth and reality.

      ED kids are harder to educate. Differences beyond that related t color and ethnicity is not that important except to those who can’t seem to wean themselves from their own perspectives on race issues.

      Interesting to me the correlation between those who do spend time on the “race gap” and their angst with regard to COVID, masking, remote learning, etc.

    2. Dick Hall-Sizemore Avatar
      Dick Hall-Sizemore

      Matt, I could probably research this question, but it is easier to ask you. Did the SOL reading test itself change significantly after 2019, thereby leading the BOE to change the cut score?

      1. Matt Hurt Avatar

        No sir. They just lowered the bar.

    3. We cannot directly compare Reading pass rates from 2019 to any year thereafter due to the Board of Education significantly lowering the cut scores for pass proficient in 2021.

      An excellent point and one that is seemingly being ignored. In order to directly compare 2019 to 2021 and 2022 we would need to know the average SOL scores, not just pass-rates.

      The passing scores for all the SOLs were reduced by a significant and, in my opinion, ridiculous, amount. The average reduction in minimum passing score was -7.6 points to already low required scores.

Leave a Reply