Counting Parents

In this post John Butcher, author of CrankysBlog, explores the relationship between K-12 academic outcomes, as measured by Standards of Learning (SOL) test scores and single-parent households. His conclusion: the data imply “a strong relationship” between the two. — JABby John Butcher

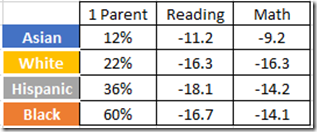
The Annie E. Casey Foundation’s Kids Count Web site includes Virginia household single-parent percentages by race and by Hispanic culture or origin. Juxtaposing those data for calendar 2010 to 2018 with the SOL pass rates for 2010-2011 through 2018-2019 produces some interesting graphs.

Note: The VDOE database offers data for students who are, or are not, “economically disadvantaged” (here abbreviated ED and Not ED). The criteria are largely driven by eligibility for free or reduced price lunches. The ED/Not ED distinction is interesting in the SOL context because ED students generally underperform their more affluent peers by some fifteen to twenty points, depending on the subject. So, let’s look at the data for both ED and Not ED students. The ideal dataset would provide single-parent counts for both economic groups. The Kids Count data are totals for each race or culture so we’ll make do with that limitation.

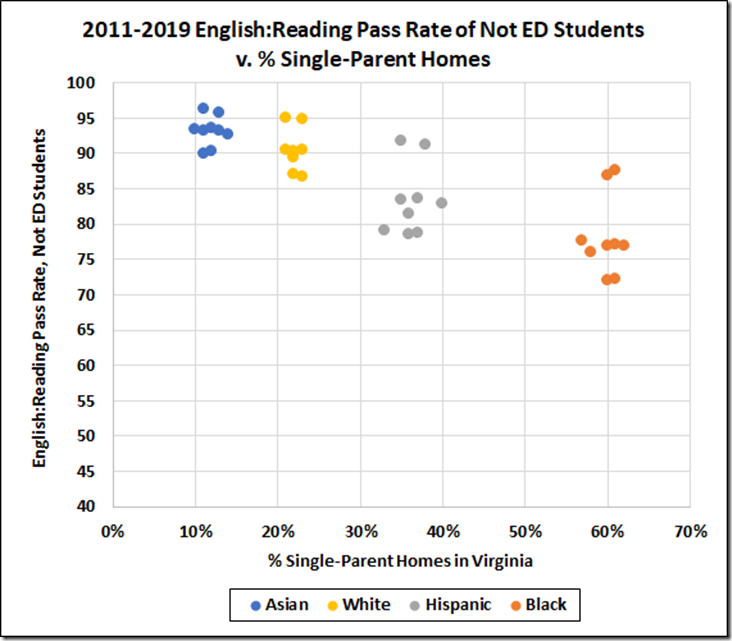
To start, the graph atop this post shows the reading pass rates over the nine-year period for Not ED Asian, Black, Hispanic, and White students v. % single-parent homes for ED + Not ED members of each group.

Of course, correlation does not tell us about causation unless we can control for all the other possible variables. Here, whatever the underlying cause(s) may be, the performance differences of the four groups are clearly related to the percentages of single-parent households.

For all four groups, the outlying pair of higher pass rates are for AY 2011 and 2012, the two years in these data prior to new, tougher reading tests.

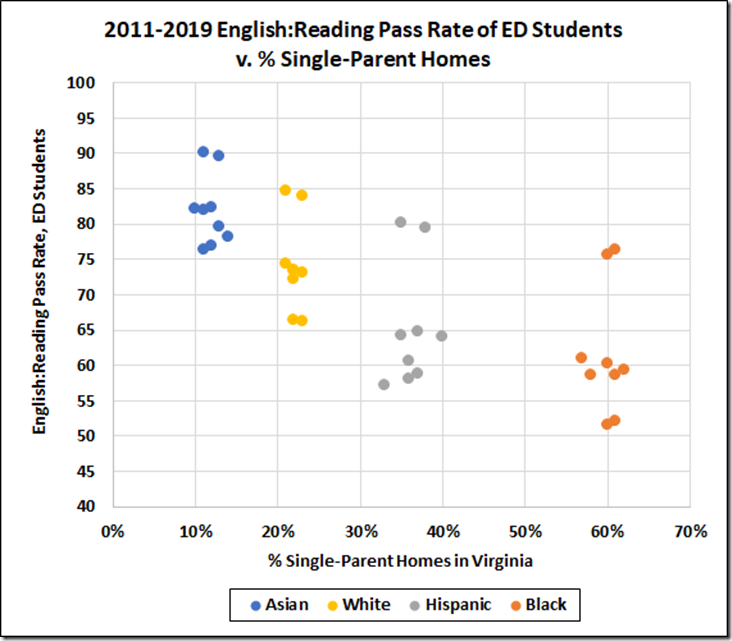
The data for the ED students show a similar pattern but with lower pass rates and larger decreases after the deployment of the newer tests.

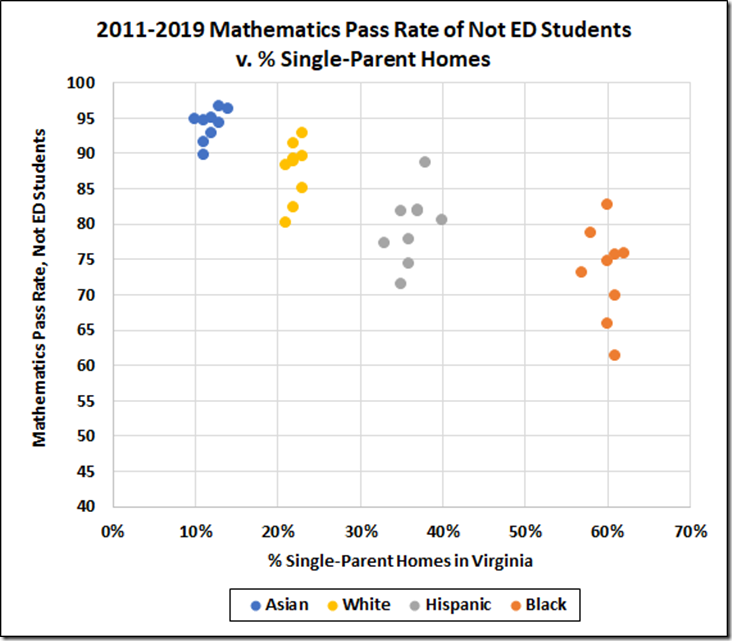
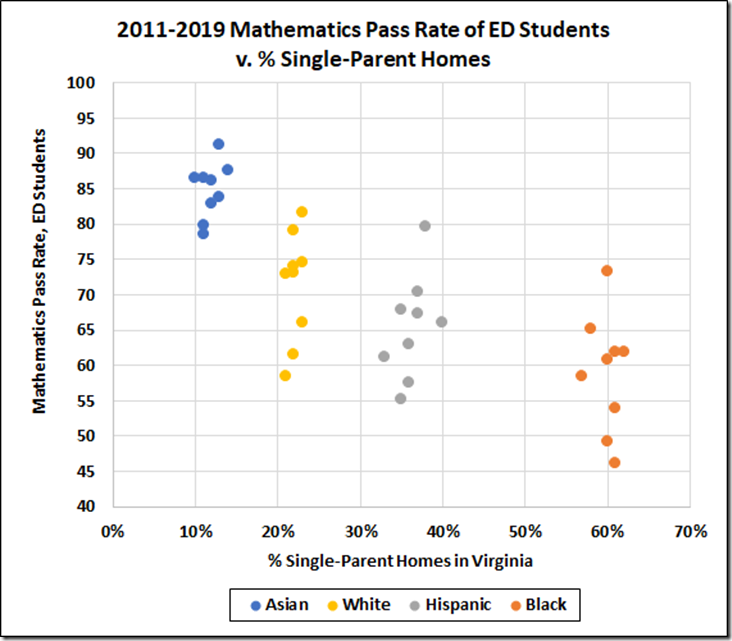
The math data paint similar pictures, albeit the new math tests came a year earlier so there is, at most, only a single high outlier in each group.

We can get another view of the relationship between pass rates and single-parent homes by looking at the averages over the 9-year span.

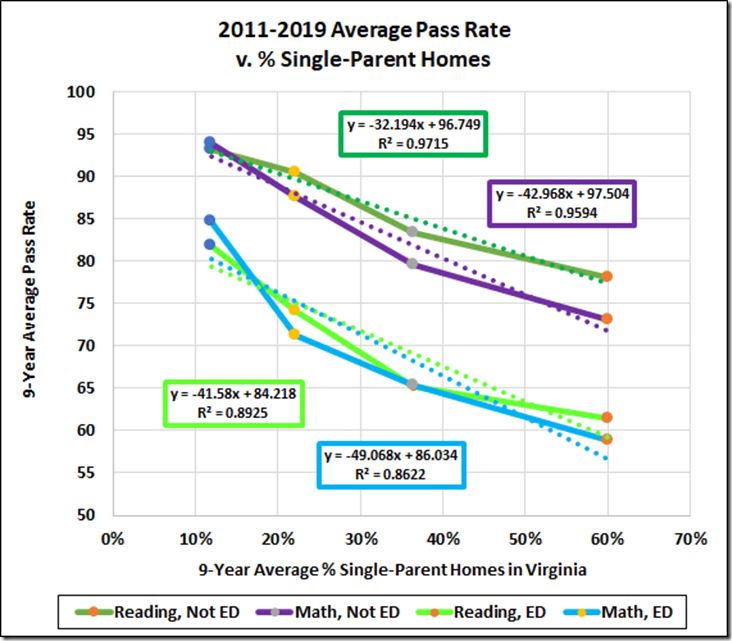
Again, these data cannot tell whether the lack of a second parent causes these effects on performance.  But they do imply a strong relationship between the number of parents in the home and SOL performance.

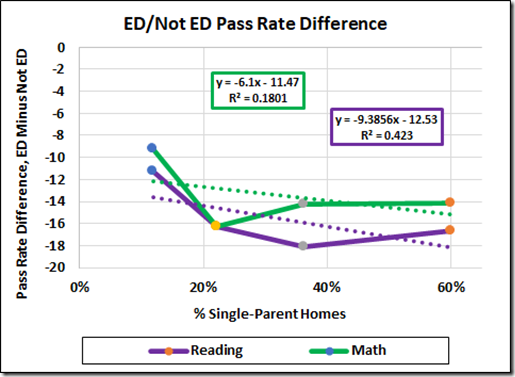
The ED/Not ED differences in these averages range from 9.2 to 18.1 points.

Per subject, the differences in the averages appear to increase slightly with increasing percentages of single-parent homes.


Share this article


ADVERTISEMENT

(comments below)


ADVERTISEMENT

(comments below)


Comments

11 responses to “Counting Parents”

  1. The evidence is clear: Family structure has a profound effect on academic outcomes. As John notes, correlation is not causality. But consider the two broad alternative theories: (1) single-parent households cause poor academic outcomes, or (2) poor outcomes cause single-parent households. Alternative #1 makes intuitive sense. Two-parent families tend to have more stable economic and domestic circumstances. Two parents can tag-team in raising kids; a single mother cannot.

    Conversely, alternative #2 is nonsensical.

    I suppose there could be a theory that presupposes a third outside variable that exercises causation through one of the two variables explored here, but I cannot imagine what it might be.

    So, what does this mean? Any theory of what ails the K-12 education system (systemic racism, for instance) and what remedies are called for (anti-racism, for instance) must be able to explain the role of family structure in student academic performance.

    1. Eric the half a troll Avatar
      Eric the half a troll

      “I suppose there could be a theory that presupposes a third outside variable that exercises causation through one of the two variables explored here…”

      Really, you can’t think of anything that would lead to single parenthood family and poorer academic performance? No underlying root cause(s)…? How about parental education, for example…? As John suggests there could be any number of variables at play here… so, no, the “evidence” is not clear…

  2. vicnicholls Avatar
    vicnicholls

    Cranky is da bomb.

  3. James Wyatt Whitehead Avatar
    James Wyatt Whitehead

    Intact family unit, income, educational level, zip code, and participation in social institutions factor into those scores.

    1. DJRippert Avatar
      DJRippert

      Why both zip code and income? Isn’t that measuring the same thing?

      1. James Wyatt Whitehead Avatar
        James Wyatt Whitehead

        Here is an example. The subsidized apartment complex down the street from Broad Run High in Ashburn. That complex allows for low income families to have access to a number of good schools with rankings to back it up.

        1. DJRippert Avatar
          DJRippert

          Got it. Thank you.

    2. Dick Hall-Sizemore Avatar
      Dick Hall-Sizemore

      That is why I suggested a multivariate analysis. Identify the weight of each factor in determining the outcome.

      1. LarrytheG Avatar
        LarrytheG

        and that would be a much more informative analysis, IMHO.

        Just using one factor can lead to a lack of understanding of the real problems… no matter how many times someone says “correlation is not causation” but still splats that data…. anyhow.

  4. Dick Hall-Sizemore Avatar
    Dick Hall-Sizemore

    This is really innovative analysis. However, the evidence is not clear to me from this data. It seems that the data are combining two variables. We know that Black and Hispanic kids generally do not do as well on reading and math tests as do white and Asian kids. Therefore, the clustering of scores of the Black and Hispanic kids on the higher single parent axis could be correlated either to ethnicity or family structure. Even in the two graphs that do not break out the ethnicities, that factor could be stronger than the family structure because Black kids are more likely to grow up in single-parent households.

    More illuminating, perhaps, would be some sort of multiple correlation analysis that could isolate the single variable that has the highest correlation in a population.

  5. LarrytheG Avatar
    LarrytheG

    I think the family income and education level of the parent are also important factors that don’t really get recognized in this kind of analysis.

    How about some charts and analysis that include those factors?

Leave a Reply