Bias-Based Traffic Stops — A Rejoinder

by Dick Hall-Sizemore

The Department of Criminal Justice Services has published its annual report on traffic stop data. In a recent article on this blog, Jim Bacon rendered his verdict on whether the data shows police bias in traffic stops: Still No Proof.

The report shows that, in the period of July 1, 2021, to March 31, 2022, Black drivers were stopped at a rate disproportionate to their estimated proportion of the Commonwealth’s total population. DCJS concluded there was, statewide, “moderate overrepresentation” of Black drivers in traffic stops.

Despite the finding of overrepresentation of Black drivers, the report is replete with caveats about the implications to be drawn from such finding. Specifically, the report says the finding of disparities “does not allow us to determine or measure specific reasons for these disparities. Most importantly for this study, this analysis does not allow us to determine the extent to which these disparities may or may not be due to bias-based profiling or to other factors that can vary depending on race or ethnicity.” The authors of the report go on to enumerate some of those other possible factors that could have influenced the disparities. It is upon this basis that Jim Bacon rests his verdict of “Still No Proof.”

Three high profile Democratic members of the General Assembly reacted angrily to the report’s conclusion that an analysis of the data did not, in and of itself, demonstrate that bias-based profiling was the reason for the disparities. “Obviously, bias is still a factor. It’s disingenuous not to arrive at that conclusion….It’s shameful but not surprising that Governor Youngkin continues to deny these truths,” fulminated Don Scott (Portsmouth), the House Minority Leader. He was joined in his indignation by Sen. Mamie Locke (Hampton) and Del. Jeff Bourne (Richmond).

There is a major problem in Del. Scott’s argument. The 2021 traffic stop report issued by DCJS under Governor Northam (Democrat) reached the same conclusions and had the same caveats as the 2022 report. In fact, the wording regarding whether the disparities result from bias-based profiling or other factors is identical in the two reports, although it is set out earlier in the 2022 report, and in bold print. Unless Delegate Scott and others levelled the same criticisms upon the publication of last year’s report (an Internet search failed to turn up any media reports of the report last year, much less any comments by critics), the comments this year can be attributed solely to partisan posturing.

The primary obstacle to measuring possible bias against a population is defining the size of that group. Ideally, when measuring bias against Black drivers, one would know how many total drivers and how many actual Black drivers there were in the jurisdiction during the time frame under consideration. Obviously, for many reasons, that is not feasible.

As an estimate of the number of drivers in a racial or ethnic group, DCJS used the estimated number of people over the age of 15 in that group as the benchmark. The report readily admits this is “only a crude measure of each group’s exposure to potential traffic stops.” Many of the shortcomings of this measure are obvious. They include:  poorer people are less likely to have cars; the cars of poor people are more likely to be in bad condition; older people either no longer drive or drive less; and some areas may have more people of another race or ethnicity driving through, who do not reside in that jurisdiction. However, as limited as it is, this is the best measure that is available.

In order to compare disparities between different racial/ethnic groups in traffic stops, DCJS standardized the data with what it calls a “Disparity Index (DI).”  The DI was calculated by dividing a group’s percentage of all stops by that group’s percentage of the total population aged 15 or older. For example, if Black drivers constituted 30% of the traffic stops in a jurisdiction and Blacks 15 years old or older were 25% of the population, the DI would be 1.2. DCJS used the following categorizations in its analysis:

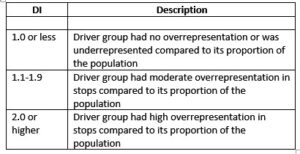
On a statewide level, the DI for Black drivers stopped was 1.6, the highest of any racial/ethnic group. Based on DCJS definitions, Black drivers were moderately overrepresented in the traffic stops in the Commonwealth.

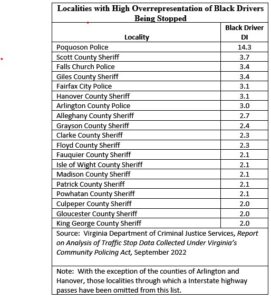
As with any statewide measures, results will vary among individual jurisdictions. Indeed, there were numerous jurisdictions with a DI of 2.0 or higher, indicating high overrepresentation. Indeed, there were several with a DI of 3.0 or higher, and one with a remarkable DI of 14.3.

The table below lists selected localities with a DI of 2.0 or higher. With two exceptions, many jurisdictions west of the Blue Ridge as well as other jurisdictions through which interstates run and which had a DI of 2.0 or higher, are not included. As the DCJS 2021 traffic stop report explains, using Carrol County as an example, the vast majority of the traffic stops in those jurisdictions may have been made on the interstate highway that runs through those localities. Therefore, the percentage of stops that were of Black drivers likely was much higher than the relatively small percentage of Black residents in the jurisdiction. (That explains the “dramatic” map noted by Jim Bacon in his article.)

The two exceptions to the exclusion of jurisdictions with interstates running through them are the counties of Arlington and Hanover. Those counties had a DI of 3.0 or higher, significantly higher than those of its immediate neighbors with interstate highways running through them. It is unlikely that law enforcement stops Black drivers traveling the interstate in those counties at a higher rate than in their neighboring jurisdictions.


My Soapbox

The legislation requiring the gathering of data for each traffic stop and the analysis of that data for evidence of racial bias was enacted by the 2020 General Assembly. The legislature that year also prohibited the use of minor equipment problems, such as a defective light over the rear license plate, as a primary reason for a traffic stop. Also, it prohibited searching a vehicle on the basis of the odor of marijuana. For years, Black advocates had complained that law-enforcement officers used these alleged violations as excuses to stop and search vehicles driven by Blacks at a much higher rate than those driven by other drivers. Ironically, the requirement to collect data on possible bias in traffic stops was enacted at the same time many of the pretexts allegedly used for such stops was placed off limits.

Another factor that may have affected the results of the analysis is missing data. DCJS excluded 17,176 records, almost three percent of the total records available, because the field indicating race/ethnicity  had been designated as “Unknown.” As the report delicately explains, “The uncertainty of the input coding for each “Unknown” race value means that there is no practical method to determine how many drivers labeled “Unknown” were actually perceived to be a certain race by the officer but such race was simply not recorded.” Another way of putting this would be that the law-enforcement officer involved did not want to be scrutinized on how he handled a stop involving a Black driver.

Yet, despite there being fewer primary reasons legally available for law-enforcement officers to make a traffic stop and despite the disqualification of a large number of records due to race/ethnicity data missing, DCJS still found evidence of moderate overrepresentation of Black drivers being stopped.

The DCJS report rightly says the data “does not allow us to determine or measure specific reasons for these disparities.” It explains, “The analysis of racial disparity is a complex field with many potential contributing factors.” Based on these caveats, Jim concludes there is no “proof” of racial bias on the part of law-enforcement officers in making traffic stops.

However, as far as law goes, “proof” is not a fixed concept. There are basically three standards of proof:

  • Beyond a reasonable doubt. In situations involving the exercise of discretion by hundreds of law-enforcement officers, it will be impossible to reach this standard of proof.
  • Clear and convincing evidence. Virginia’s model jury instructions (Instruction no. 3.110) define this standard as evidence that creates “a firm belief or conviction” that the case has been proved.
  • Preponderance of the evidence. Instruction no. 3.100 of the Virginia model jury instructions defines this standard as follows: “Evidence which you find more persuasive, when evaluated against all of the evidence that has been admitted in the case.”

Because the data show that Black drivers were moderately overrepresented with a DI of 1.6, despite the disallowance of many reasons previously allowed for a traffic stop and despite the omission of thousands of records due to the race/ethnicity of the driver being “Unknown,” I submit that, based on a preponderance of the evidence, racial bias still exists in traffic stops in the Commonwealth, particularly in some localities.

Speaking of possible bias in some localities, Attorney General Jason Miyares should devote some of his time and resources investigating the possibility of racial bias in traffic stops in localities with a DI of 3.0 or higher. He has that authority under Sec. 2.2-520, which creates an Office of Civil Rights in the Office of the Attorney General with authority to “Inquire into incidents that may constitute unlawful acts of discrimination.” Something along these lines certainly seems to be going on in the city of Poquoson.

In fairness to Jim Bacon, he concludes his article with this statement: “We want to get to the truth of the matter. It’s wrong to sweep evidence of racism under the rug; we want to identify it and correct it where it exists…. Let’s find out if bias exists, where it exists and how acute it is rather than indulge in blanket accusations.”

I assume from this statement that he would not think there is enough evidence to meet the “preponderance” standard. To help get closer to being able to determine the role of bias in these stops, DCJS, in its 2021 report recommended that the legislation be expanded to include the following data:

  • Time of day of the stop;
  • Whether contraband was discovered and, if so, its nature;
  • Race/ethnicity of the law-enforcement officer making the stop.

Jim endorsed the gathering of that data.

Delegate Luke Torian (D-Prince William), the patron of the 2020 legislation, introduced legislation (HB 1142) in the 2022 General Assembly that would have expanded the data that officers would be required to collect at traffic stops to include those items listed above, as well as the following data:

  • Address, neighborhood, or ZIP code of the traffic stop;
  • Duration of the stop;
  • Details of any pat down or search;
  • Whether there was an outstanding arrest warrant on the driver.

The bill was killed in subcommittee on a 5-3 vote, with all the votes in opposition coming from Republicans. During the subcommittee discussion, most of the opposition to the bill centered on the additional time and cost for law-enforcement, particularly in small departments. There was some general allusion to technology being available to gather some of the information being requested.  In 2020, all 35 votes against the original bill were cast by Republicans. Although delegates Davis (Virginia Beach) and Webert (Fauquier) voted for the final version of the 2020 bill, they joined their Republican colleagues on the subcommittee in opposition to expanding the information collected. It would seem that a majority of the General Assembly Republicans are not interested in “getting to the truth of the matter.”


Share this article


ADVERTISEMENT

(comments below)


ADVERTISEMENT

(comments below)


Comments

22 responses to “Bias-Based Traffic Stops — A Rejoinder”

  1. walter smith Avatar
    walter smith

    Figures don’t lie, and liars figure.
    If you believe everything is racist, you look for patterns and “facts” to support your view.
    The stop statistics – by themselves – mean nothing. Is it possible black drivers drive more unsafely? Yes. Is it possible there is police bias making stops of black drivers disproportionately? Yes.
    But, if we accept your “disparate impact” theory, then it would seem nearly all UVA athletic teams (and likely all major programs) discriminate against white athletes. Do you believe that? Or is it POSSIBLE that in fair competition the black athletes were better than the white athletes? (I know it is hard to admit such a thing because it destroys your narrative)
    Accepting disparate impact analysis, how come a black applicant to UVA for the Class of 2026 had a 29% chance of receiving an offer of admission, while a white applicant had a 17% chance? (This is actual evidence of racial discrimination, but it’s for a good cause, amirite?)
    What is the composition of the police forces? If the black officers stop black drivers at the same disproportionate rate, would that negate your theory? In fact, I would bet black officers may be more willing to stop black drivers because the white officers fear you “everything is racist” people calling them racists for doing their jobs!
    Here’s another riddle – do blacks commit crimes at a disproportionate rate? Could that propensity carry forward to driving? (And this one is just to drive Mr. SCIENCE! crazy) Is it possible there is some causative factor to crime rate incidence and traffic violations with illegitimacy (black and white)? Does the absence of fathers cause young men to grow up not knowing how to act under authority?
    Hey – one more on driving – are the cops sexist and hate men? Without even looking would I be correct to guess that the police are disproportionately male and that tickets to men outnumber tickets to women at least 2 to 1? Proof!

    1. James McCarthy Avatar
      James McCarthy

      Some posts are evidence but not proof of non-understanding. Is it possible that Blacks have no color?

      1. walter smith Avatar
        walter smith

        Are you denying “blackness?”
        Some people self-identify as white saviors…
        Which seems kinda racist to me…

      2. Is it possible that Blacks have no color?

        Well, the “color” black is what results when very little or no light from the visible spectrum is reflected by an object.

        White, on the other hand, results from an object reflecting most or all of the visible light spectrum.

        I suppose it could be argued that Blacks have no color, and that Whites have all the color. Would that make the electromagnetic spectrum racist?

      3. Is it possible that Blacks have no color?

        Well, the “color” black is what results when very little or no light from the visible spectrum is reflected by an object.

        White, on the other hand, results from an object reflecting most or all of the visible light spectrum.

        I suppose it could be argued that Blacks have no color, and that Whites have all the color. Would that make the electromagnetic spectrum racist?

  2. Super Brain Avatar
    Super Brain

    An old trick was to set up radar where lower income folks drove.
    The CA’s did not want to face well paid lawyers and offend the wealthy community.
    Lower income people of all origins suffered.

  3. Bob X from Texas Avatar
    Bob X from Texas

    Questions that need asking:
    1. Younger drivers commit more traffic infractions than older drivers. The most common age among whites in U.S. is 58 – more than double that of racial and ethnic minorities. Was this factored into the survey?

    2. It is impossible to determine the race of a driver at night until a flashlight lights up the face of a driver. Pulling people over based on race is impossible at night. Was this factored into the survey?

    1. how_it_works Avatar
      how_it_works

      I suspect that older drivers are also more likely to get a warning. At least that’s been my experience!

    2. Dick Hall-Sizemore Avatar
      Dick Hall-Sizemore

      1. Age is one data point that the law requires be collected at traffic stops. However, DCJS did not use age in its analysis. Older drivers tend to drive less than younger ones. That might be why they commit few traffic infractions, although the rate may be similar. It would be extremely difficult, I think, to factor in age when estimating the number of drivers in a specified racial/ethnic group.

      2. You are correct about the time of day. In its 2021 report, DCJS noted that research shows that “non-White drivers are stopped less often during nighttime hours.” It recommended that the time of day of the stop be one of the data points required to be collected. HB 1142 in the last session included that requirement, but the bill was defeated. In the discussion, some members questioned why that data was needed. Unfortunately, the DCJS representative did not have a good answer.

      1. Lefty665 Avatar

        In addition to fewer miles I’m certainly driving less aggressively as I age. I’ve (knock on wood) not gotten a speeding ticket in a decade.

        With mortality being what it is the ratio of female to male drivers undoubtedly increases with age. It has long been my experience that women get pulled less and written fewer tickets than men. Cops write tickets to get testosterone’s attention, although I never understood why they thought testosterone could read.

  4. Dick, thank you for a post that is not only well reasoned but addresses my actual positions on the topic. This is a model of how I like to see debate unfold on this blog.

    You raise an interesting philosophical question: what standards of proof should we apply — beyond a reasonable doubt, clear and convincing, and preponderance of the evidence. I hadn’t paid any consideration to those distinctions, but I’ll give it some thought.

    It sounds like we agree on the most important point, which is to gather more data so we can answer the question of bias more authoritatively. It’s unfortunate that some Republicans opposed the collection of additional data.

    I don’t see how we get to the bottom of the issue any other way. The fact is, the “driving while black” meme is stuck in the public consciousness. It’s largely accepted as fact. Perhaps the gathering of more comprehensive data will yield a result that makes Republicans feel uncomfortable… in effect confirming what most everybody already believes to be true. On the other hand, more comprehensive data might find that bias is scattered and isolated, and that the driving-while-black meme is mostly unfounded.

    In other words, I would try to persuade Republican lawmakers that they have more to gain than lose by getting authoritative answers. And, if it turns out that racial bias remains a significant factor in traffic enforcement, then Republicans should want to get in front of that issue.

  5. Unless Delegate Scott and others levelled the same criticisms upon the publication of last year’s report (an Internet search failed to turn up any media reports of the report last year, much less any comments by critics), the comments this year can be attributed solely to partisan posturing.

    The Richmond Times jumped right on that in their article on the issue, didn’t they?

    What? They DIDN’T? Well that’s interesting.

    Then again, perhaps they were too busy kissing democrats’ a$$es, and trying to keep racial unrest simmering so they can sell more papers, to notice and/or point out the utter hypocrisy of those individuals.

    1. Dick Hall-Sizemore Avatar
      Dick Hall-Sizemore

      I attribute it more to either laziness or pressure to get a story out on the Internet that the reporter did not think to look at last year’s report.

      1. You are very kind.

  6. Lefty665 Avatar

    It would seem that Poquoson sticks so far out that it deserves careful scrutiny.

    Fairfax City and Falls Church are both small cities in urban northern Virginia, and Falls Church at least is decidedly woke. Is it possible their ratios are over reported due to transient stops like places with interstates or a small numbers of stops with a small black local population? Are they under reported due to small black populations compared to the state average? (see Hanover below for potentials for both errors)

    Hanover has a small black population, less than 10%. With a small population a small number of stops could skew the calculation upward. That may be the case in other localities too.

    We have breakouts of population by race for Virginia localities. It is a slightly labor intensive, but very doable, task to calculate the ratio based on racial distribution by locality. In Hanover for example the actual small black population means the overall state average used by DCJS reduces the reported ratio.

    What does the other end of the scale look like? Are there localities with ratios less than 1?

    Edit: See Dick’s response to me. Between DCJS and his own efforts they have controlled for both the errors I was concerned with above. Thx, Dick

    1. Dick Hall-Sizemore Avatar
      Dick Hall-Sizemore

      As explained in the Appendix to the report, the DI calculations for localities were based on “how many drivers in each group were stopped relative to the group’s driving-age representation in the resident population of the locality served by the agency.” (My emphasis).

      The localities with a DI of less than 1.0 for stops of Black drivers were:

      Emporia
      Essex Co
      Galax
      Greensville Co.
      Lexington
      Sussex Co.

      There were a few more, but the total number of stops in each locality was very small; therefore I did not include them.

      1. Lefty665 Avatar

        Thanks, I apologize if I failed to read closely enough. Looks like between you and DCJS you controlled for the variables and potential errors I was looking at.

    2. DJRippert Avatar

      The City of Falls Church is a typical example of modern wokeness. That city was cleverly clawed out of Fairfax County leaving a very wealthy and very white and Asian population compared to Fairfax County. While the percentage of Black residents of Fairfax County went up from 2010 to 2020, the percentage in the City of Falls Church went down. COFC has 3.7% Black residents, surrounding Fairfax County has around 9.4%.

      One point of aggravation for the woke White of Falls Church is the fact that Rt 7 runs pretty much straight through the damn place. Imagine! The unwashed driving straight through the carefully manicured homes in Falls Church! There definitely needs to be aggressive traffic stops, especially f0r minorities. What next? Minorities in Meridian High School? I mean the wokesters did rename George Mason High School to Meridian High School. Wasn’t that enough? There are already 4.5% Blacks in Meridian High School! What do people want? The same 10% as is the case in surrounding Fairfax County Public Schools.

      Heaven forbid!

      Just don’t tell Ron DeSantis about Falls Church. The last think those hypocrites need is 50 immigrants being dropped on their doorsteps.

    3. DJRippert Avatar

      The City of Falls Church is a typical example of modern wokeness. That city was cleverly clawed out of Fairfax County leaving a very wealthy and very white and Asian population compared to Fairfax County. While the percentage of Black residents of Fairfax County went up from 2010 to 2020, the percentage in the City of Falls Church went down. COFC has 3.7% Black residents, surrounding Fairfax County has around 9.4%.

      One point of aggravation for the woke White of Falls Church is the fact that Rt 7 runs pretty much straight through the damn place. Imagine! The unwashed driving straight through the carefully manicured homes in Falls Church! There definitely needs to be aggressive traffic stops, especially f0r minorities. What next? Minorities in Meridian High School? I mean the wokesters did rename George Mason High School to Meridian High School. Wasn’t that enough? There are already 4.5% Blacks in Meridian High School! What do people want? The same 10% as is the case in surrounding Fairfax County Public Schools.

      Heaven forbid!

      Just don’t tell Ron DeSantis about Falls Church. The last think those hypocrites need is 50 immigrants being dropped on their doorsteps.

      1. Dick Hall-Sizemore Avatar
        Dick Hall-Sizemore

        Another aggravation for the good folks living in Falls Church is probably the fact that Falls Church High School is part of the Fairfax County school system!

        1. Lefty665 Avatar

          And the City’s High School, previously known as George Mason, is in Fairfax County. There was never any doubt which one you attended or why. 🙂

      2. Lefty665 Avatar

        When Falls Church separated from Fairfax County there were very few asians, or anything but white folks. I was in high school when the city schools integrated. There were a grand total of 2 black kids in a Jr Sr high that went from grades 7-12. The percentage of minority residents and students has gone up considerably since then.

        It was a shame when they flattened out Rt 7 (Broad Street), widened it and cut down all the big old trees. It did give the city cops a couple of good places to frequently run radars. They were not far west of 7 corners and on a slight down slope with 4 lanes and a 25 mph speed limit. I wouldn’t be surprised if they still do. I remember kids getting busted for putting out “Radar Ahead” signs.

        Renaming the high school was more than enough. Woke imposition of ex post facto morals should be every bit as illegal as with laws. We owe a debt to George Mason for the Virginia Declaration of Rights that were the basis of the Bill of Rights and for keeping the young hot heads (Jefferson and Henry especially) from squabbling with each other rather than fighting the British.

        Rehoboth Beach at Biden’s house in the summer is where DeSantis should drop immigrants. That would be more effective than Martha’s Vineyard by offending large numbers of politicians and federal bureaucrats along with the fat cat neo liberal elites. The Secret Service would have them out of there to cells, aka deluxe accommodations, at Dover AFB in a hurry. At 48 hours Martha’s Vineyard was pathetically slow on the uptake.

Leave a Reply