
Matt Hurt, director of the Comprehensive Instructional Program coalition of rural school districts, provided detailed feedback on a recent post, “School Districts’ COVID Recovery Varied Widely
.” His comments contribute significantly to the discussion of the impact of COVID school closures in 2020-21 on Standards of Learning test scores in 2021-22, so, I republish them with minor modifications here. — JAB
by Matt Hurt
According to my calculations, 47% of the variance among overall division pass rate differences in 2021 was due to the amount of in-person instruction offered combined with the poverty rate of the division.
When I discussed this with our teachers and administrators, it seemed to explain a lot. The way that they put it, kids of affluent parents tended to have the supports in the home to make sure the kids attended to their work when they were participating in virtual instruction. Kids who live in poverty were much less likely to have anyone standing over them making them do their work. Given this situation, these kids found much more engaging activities in which to invest their time than school work. I suspect that the amount of in-person instruction in 2021 did affect the 2022 outcomes, but I haven’t had the time to calculate that yet.
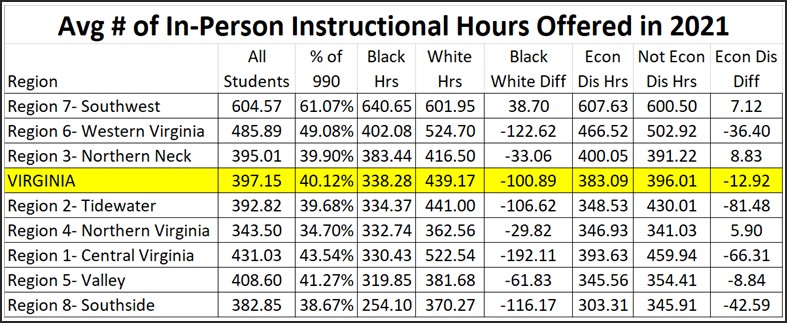
Second, the designations posted on the VDOE website were a very poor representation of how much in-class time was offered to students. For example, I am not aware of any division that offered a full school day, five days a week of in-person instruction during 2021, even some of those that were designated as having done so. The much more reliable measure can be found in the reports that were provided to VDOE during the summer of 2021. These reported the actual number of hours of in-person instruction that were offered to students that year.
We attempted to look at student-level data indicating the number of hours each student attended in-person versus virtual, but we found that data was too unreliable, as everything was in chaos and some kids changed between the two more than they changed their underwear. Therefore, the summer reports (which were used to create the table below) I consider to be the most reliable, accurate data we have of in-person instruction.
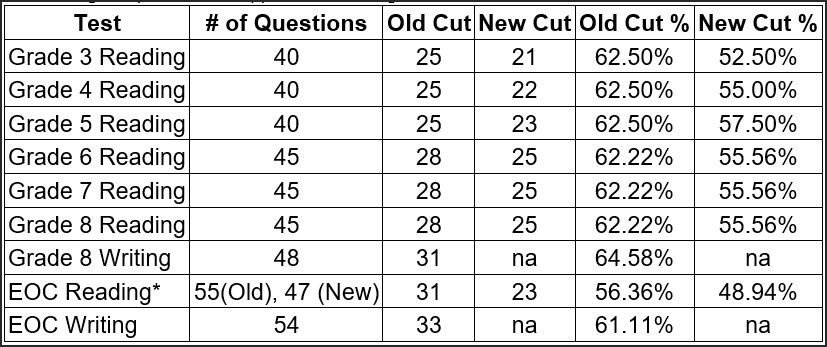
Third, the cut scores used to determine Reading SOL scores from 2013 through 2019 are listed below as the “Old Cut.” In 2021, we began to administer the newer SOL Reading test, and those cut scores are the “New Cut” scores in this table. As you can see there is a significant difference between the two, with the newer cut scores being lower, thus it is now easier for a kid to pass his/her reading test than prior to the pandemic. The math cut scores were lowered in 2019 and have remained constant since, so the math comparisons from 2019 to 2022 are apples-to-apples, while the reading comparisons are apples to Volkswagens.
I’m still digesting the data, and once I get it all right in my head, and my colleagues confirm by finding our study reasonable, I’ll fill you in on what we find.
BTW, when the state accreditation numbers are published next month, the scores will magically and significantly improve, at least for 3-8 reading and math. The 2021 General Assembly through [its] “growth” bill will make things look much better, but a bunch of that seems to be “growth” in name only.
Leave a Reply
You must be logged in to post a comment.