
Virginia’s eviction-reform movement gained considerable momentum last year when the New York Times, citing data of the Princeton Eviction Lab, published a story asserting that four Virginia cities numbered in the top 10 cities with the highest eviction rates in the country. Richmond supposedly had an eviction rate five times the national average. Armed with this scandalous data, renters rights advocates pressed successfully for changes to state law that make it somewhat easier for tenants to avoid eviction.
Now a VPM (Virginia Public Media) investigation has revealed significant flaws in the data. The first problem is one that I identified shortly after the Times article was published: The reason Virginia cities stood out so prominently in the Top 10 list was not that Virginia laws are tougher on renters but because Virginia’s city/county form of government skewed the data.
A second problem is that Princeton Eviction Lab cobbled together different data sets for different states. The Lab was able to obtain court data directly from 12 states, including Virginia. For the others, they used data from private sources.
Thirdly, the Prince Eviction Lab data is based on eviction filings — not actual evictions. Richmond Sheriff’s Office data indicates that landlords filed 17,000 unlawful detainers in Richmond General District Courts, but sheriffs executed only 2,427 evictions.
The bottom line, Patrick McCloud, president of the Virginia Apartment Management Association, told VPM, is that Virginia landlords and Virginia tenant law got a “bum rap.”
None of this should come as a surprise to anyone who has tracked New York Times news reporting. But I will say that the VPM piece did come as a surprise — a positive one. Although author Ben Paviour didn’t slant his story the way I would have, he did extensive research and developed information that cut against the public media’s social-justice narrative. So… kudos to Paviour.
Now, let’s take a deeper dive into the three points highlighted above.
City/county form of government. Virginia is the only state in the country with a system of independent cities. In every other state, cities overlap with counties, providing different government functions. As Paviour summarizes McCloud’s explanation:
Independent cities like Richmond and Hampton have higher rates of eviction filings because they don’t include wealthier surrounding counties, where eviction rates are generally lower. Most states lump cities and counties together.
Most researchers outside Virginia are unfamiliar with the issue, and the problem occurs over and over again in city rankings. It’s the reason why I have ceased publishing national rankings of “cities.” The results are meaningless.
Data accessibility. McCloud says that court data in Virginia is unusually accessible; Desmond and his researchers were only able to obtain court data from 12 states directly, though they augmented that information with private data sources.
According to the Eviction Lab’s explanation of its methodology, researchers accumulated more than 80 million eviction records. Data from 12 states, including Virginia, came directly from court records. For the others, Eviction Lab purchased datasets of public eviction records from LexisNexis Risk Solutions and American Information Research Services Inc., as well as county-level statistics from 27 states, New York City and the District of Columbia. For regions for which there was no comprehensive data, the Lab engaged in a “common practice for missing data called ‘imputation.’”
Court judgments versus evictions. McCloud says the Princeton data is unfair because it tracked court judgments rather than actual evictions. Often, he says, landlords who win a case don’t actually end up evicting their tenants. Some tenants reach a deal with their landlord; some leave before formal eviction.
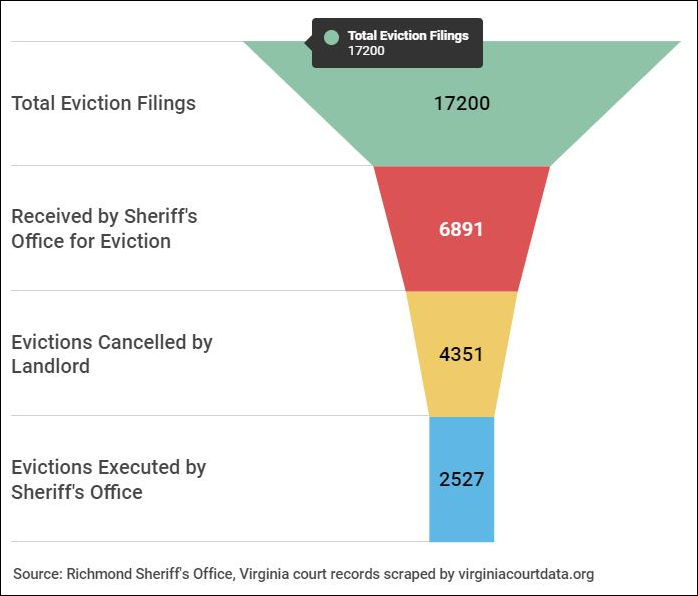
While there is no comprehensive statewide data, VPM found data for 2018 City of Richmond tenant evictions. As shown in the graphic above:
- There were 17,200 eviction filings,
- 6,891 judgments received by the Sheriff’s Office for eviction,
- 4,351 evictions, and
- 2,527 actual evictions executed by sheriffs.
“Those types of things really skewed the data and made Virginia look bad in a state that really has a very even-handed landlord tenant law,” McCloud said.
None of this is to say that evictions aren’t a real and growing problem. A mismatch between the supply and demand of housing across Virginia’s major metropolitan areas is driving up rental prices. That may be making it harder for lower-income tenants to keep up their payments, although the evidence for that is ambiguous at best, as seen in this graph published by VPM:

After peaking in 2011, the rate of evictions fell sharply later in the decade and has leveled off.
There are bad landlords — typically referred to as slumlords — who mistreat their tenants. There must be laws to protect tenants against genuine abuses. But there are bad tenants, too. If it becomes too difficult to evict problem tenants, landlords have to build the prospect of greater legal expenses and unpaid rent into their business models, and that could entail raising rent for all tenants, including the good ones. That’s a result nobody wants.
Leave a Reply
You must be logged in to post a comment.