COVID-19 Update: Mounting Toll

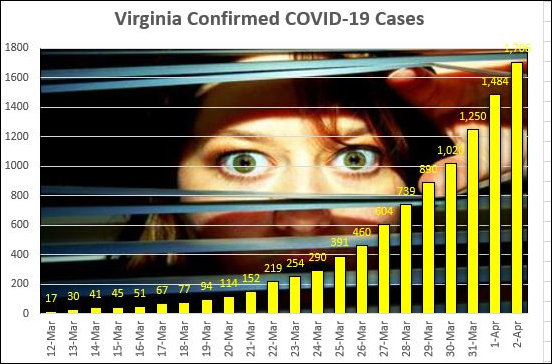
Here’s the latest COVID-19 data from the Virginia Department of Health based on yesterday’s developments.

Total cases: 1,706, up 222 yesterday.
Total hospitalizations: 246, up 38 yesterday.
Total deaths: 41, up 7 yesterday.
Total tests: 17,589, up 2,245 yesterday.

And here, straight from Cranky’s Excel spreadsheet to you, the updated “doubling” time for key metrics:

Case count: 3.3 days
Hospitalizations: 3.7 days
Deaths: 2.9 days

Finally, we have a social justice alert! I can’t believe the racial bean counters haven’t seized on this yet. Here is the VDH breakdown of COVID-19 cases by race:

Source: VDH. Number of confirmed cases (first numerical column) and percentage of confirmed cases (second numerical column).

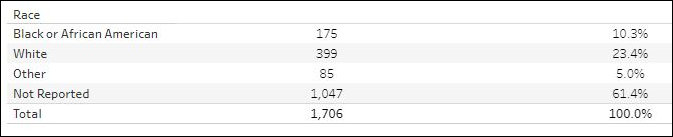
If we toss out the “race not reported,” we have a total of 659 cases. Of those, 26.5% are black, 60.5% are white, and 12.9% are other. Whites comprise 68.0% of the population, while blacks 19.2% and others. Therefore, whites are somewhat under-represented among COVID-19 patients and blacks over-represented.

Looking for explanations for this disparity, I think we can rule out the possibility that the COVID-19 virus itself is biased against blacks. That leaves one of two possibilities:

  1. The Northam administration response to the epidemic has been biased against blacks.
  2. Blacks are more likely to reside in densely populated urban areas where the population is more exposed to the disease, while whites are more likely to reside in western Virginia, which has been less affected by the epidemic.
  3. The percentage of “race not reported” is so large that sampling methodologies may be biasing the results, rendering them meaningless.

Have I missed something?


Share this article


ADVERTISEMENT

(comments below)


ADVERTISEMENT

(comments below)


Comments

27 responses to “COVID-19 Update: Mounting Toll”

  1. Of course it’s 3. How do you “toss out” over 61% of the reported cases where race is not reported and get a meaningful result? Let’s toss out the notion of reporting skewed numbers and calling it injustice.

  2. Steve Haner Avatar
    Steve Haner

    With over half the sample not reporting, the rest of your conclusions are crap. We’re going to get you hooked up with a statistics class, Jim, you need it badly. On line, of course. Leave it to Cranky.

    Dr. Gottlieb, late of the FDA, was on CNBC (again) just a while back. Watch that “time to double” stat as the key signal for when this is flattening out in any given area.

    1. djrippert Avatar
      djrippert

      What part of Jim’s third comment were you unable to comprehend?

      “3. The percentage of “race not reported” is so large that sampling methodologies may be biasing the results, rendering them meaningless.”

  3. Steve Haner Avatar
    Steve Haner

    https://www.baconsrebellion.com/app/uploads/2020/04/datafallaciestoavoidv4.png

    This was part of a raging debate on Twitter. Hat Tip: Albert Pollard.

    1. WayneS Avatar

      Excellent chart. I have saved the image. Thank you for posting it.

  4. Sorry, Steve, when you write that my conclusions are “crap,” I have to ask if you passed 5th grading reading class.

    Here’s how I concluded the piece: “The percentage of ‘race not reported’ is so large that sampling methodologies may be biasing the results, rendering them meaningless.”

    1. Steve Haner Avatar
      Steve Haner

      As Mrs. Truman once said, it took her a lifetime to get Harry to use that word…sorry.

      You listed that final point as just one of three possible conclusions, putting your race-obsessed points above it. It was equal to the other two, not your final conclusion. Points one and two are inflammatory (how ’bout that word?) in light of the weak data.

  5. djrippert Avatar
    djrippert

    Why are Asian-Americans not counted as a separate class? I know Progressives hate to consider Asian-Americans a minority because it destroys their white privilege mythology. Is that why Asian-Americans are not being counted?

  6. vaconsumeradvocate Avatar
    vaconsumeradvocate

    JB, I believe your last statement is correct. I don’t think we can draw these conclusions yet. However, I’ll offer the perspective that maybe the virus is resulting in more sickness based on socioeconomic situation and related status of health care instead of race alone. It may be necessary to look at communities, types of jobs/personal travel. It’s just too early to make such a conclusion, especially with so much missing data.

    Clearly the data collection system is not prepared for answering the questions we have right now and we may not even be collecting the right data. It’s hard to believe that the race question only includes black, white, and other. It may be that there are too few cases to be more specific than that.

  7. Nancy_Naive Avatar
    Nancy_Naive

    One of two? Well, it that case I choose 4) none of the above.

    Or, 5 who watches the news?

  8. WayneS Avatar

    “The percentage of “race not reported” is so large that sampling methodologies may be biasing the results, rendering them meaningless.”

    Yes.

  9. djrippert Avatar
    djrippert

    My guess? By the end of the summer Virginia will have suffered 1,850 deaths from COVID-19. Hopefully not but that’s my guess at this point. On the bad news side our testing is still shambolic. While the total number of tests per day is increasing other states are increasing faster (per capita). Barring a breakthrough in Virginia I expect that both Texas and Kentucky will pass us by the weekend. That will leave Virginia in last place for per capita testing among states that fully report their data. On the good news side we just don’t don’t have the large number of people living in high density areas. How do people in Manhattan practice social distancing while riding on an elevator with other people to get to the ground floor of their apartment buildings to get groceries? Arlington and Alexandria need to be watched carefully. They have the most people living in high density. However, I believe they also skew younger.

  10. Jim,
    In agreement with Steve Haner above at 10:00 a.m.
    Sorry if I offended you, but it was the “may be biasing the results” rather than a more definite statement that triggered my reaction.

  11. Nancy_Naive Avatar
    Nancy_Naive

    You can, of course, make the conclusion. It’s just that with over half your data not reporting, you should include the margin of error, e.g., Black — 26.5% +/-10%

  12. For the record, I was engaging in snark. To the extent that my words were taken as serious commentary, I failed. My intention was to poke the social justice zealots who view everything through the prism of race and see any racial disparity as evidence of discrimination and racism. Explanation #1 — the Northam administration response to the epidemic has been biased against blacks — was entirely facetious. Of course that’s not the case, at least not at a conscious level. But turnaround would be fair play if the SJWs went after Northam after the governor has pushed the SJW philosophy so aggressively in state government and schools.

    By the way, explanation #2 — different racial groups have differential exposure to the virus depending on where they live — is a perfectly reasonable hypothesis. You can be darn sure that someone will trot it out when, as is inevitable, the SJWs start drawing the connection between race and infection rates.

    1. Nancy_Naive Avatar
      Nancy_Naive

      Whose conscious level, his or yours?

  13. Of more interest are the Age breakdowns, which show although elderly are hit more per capita, the 18-55 population is hit quite hard too. also Male/Female may be interesting.

    1. djrippert Avatar
      djrippert

      I think breakdowns by the residents’ areas of population density will provide the most useful information. Then, age and pre-existing medical conditions. Then sex. I doubt race has anything to do with this.

      Unfortunately, our testing regime is so weak in Virginia that COVID-19 deaths are the only reliable statistic to track and, in the cruel calculus of statistics, 41 is too few deaths to draw meaningful conclusions.

      However, New York is testing at a very fast pace. I think we can look at the experience in New York and “extrapolate” that experience to Virginia.

      1. Nancy_Naive Avatar
        Nancy_Naive

        I don’t know. I think density question may be OBE. The latest reporting is that the CDC is saying that asymptomatic transmission can occur simply by breathing and talking (coughs sneezes not necessary.

      2. Density is unquestionably a factor. It is not coincidence that the worst hot spot in the U.S. is New York City, which is the most densely populated metro in the city, where, as Don points out, elevators are ubiquitous and the highest percentage of the population of any metro in the country relies upon mass transit.

        1. Reed Fawell 3rd Avatar
          Reed Fawell 3rd

          “Density is unquestionably a factor.” Yes, true, and irresponsible behavior by individuals within density turbo charges deaths by this virus. We surely have proven that by now too.

        2. Nancy_Naive Avatar
          Nancy_Naive

          Is not San Fran just as dense? Yes, clearly cities are an issue, but my error was in not wording as “the sense of security (superiority) in suburbia may be OBE.”

      3. From a public health perspective, we would anticipate that African Americans will be more severely impacted if infected by COVID-19 , though not necessarily infected at a greater rate. Higher incidence of diabetes, high blood pressure, and among inner city African Americans, higher rates of asthma, make that demographic vulnerable to worst version of this virus.

    2. Steve Haner Avatar
      Steve Haner

      Clearly harder on males, world wide.

  14. Reed Fawell 3rd Avatar
    Reed Fawell 3rd

    Some perspective:

    Total Deaths in Virginia so far: 41 have died. This out of Virginia’s total population of 7.294 million.

    The Deadliest Battles in the Civil War

    Gettysburg was the bloodiest battle of the Civil War, with more than 51,000 casualties, including 7,863 dead. Battle deaths in the Civil War totaled nearly 215,000. But remember, about 620,000 Americans, or 2% of the population, died in the American Civil War. That’s proportionally is equivalent to 6 million people dying in the US today.

    Below is a list of the deadliest battles in the war. See:
    https://www.infoplease.com/us/american-wars/deadliest-battles-civil-war

  15. TooManyTaxes Avatar
    TooManyTaxes

    About 1 million or 12% of the population of Ireland died between 1845-49 during the potato famine. And the Brits kept exporting Irish grain to England.

    1. Reed Fawell 3rd Avatar
      Reed Fawell 3rd

      Wait a minute. How the hell that happen? The Irish were white, not black!

Leave a Reply