2022 SOL Data: Economically Disadvantaged Gap Widens

by John Butcher

2020 was the first spring since 1998 without SOL tests in Virginia.

Then came 2021, when participation in the testing was voluntary. The VDOE press release said, “In a typical school year, participation in federally required tests is usually around 99%. In tested grades in 2021, 75.5% of students took the reading assessment, 78.7% took math, and 80% took science.

So, the ‘22 data are the first post-pandemic numbers with a claim to measuring anything beyond individual performance.

But first: as we have seeneconomically disadvantaged students (“ED”) underperform their more affluent peers (“Not ED”) by around twenty points, depending on the test. This renders comparisons of the school and division and state averages meaningless because of the varying percentages of ED students. Fortunately, the VDOE database offers data for both groups. Hence the more complicated analyses below.

First, the state data for the reading tests. Note: the decreases in 2013 were the result of the adoption of new, tougher reading tests.

Comparing the ‘22 and ‘19 data, we get:

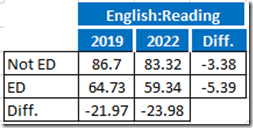
Caveat: “[T]he reading results for 2021-2022 understate the extent of learning loss — especially in the early elementary grades — given the adoption of less-rigorous proficiency standards by the Board of Education when introducing new reading tests during the 2020-2021 school year.”

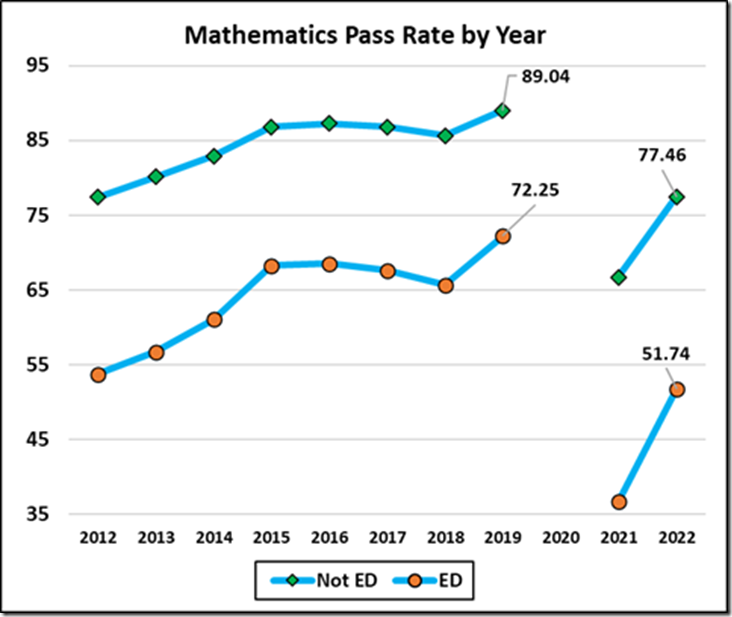
Next, math, where the 2019 and 2022 pass rates both show the effects of the relaxed grading in 2019.

A later post will look at the division data.

John Butcher, a retired attorney, lives in Richmond. This column was republished with permission from Cranky’s Blog.


Share this article


ADVERTISEMENT

(comments below)


ADVERTISEMENT

(comments below)


Comments

17 responses to “2022 SOL Data: Economically Disadvantaged Gap Widens”

  1. Eric the half a troll Avatar
    Eric the half a troll

    I know you want to ignore the 2021 data, but the story looks pretty good with it in place. Still not back to pre-pandemic levels but even the Economically Disadvantaged Gap is improving by comparison… pretty sure that the 2021 data was not ignored here at BR when it came out… right…?

    1. James C. Sherlock Avatar
      James C. Sherlock

      It was by me for the reason stated in the article above. It was not only a voluntary test, but the school divisions had wide variations in when the teachers and kids returned to the classrooms. Try harder for your snark next time. This one fell flat.

      1. Eric the half a troll Avatar
        Eric the half a troll

        If the data was no good, why was it reported as calamitous here on BR…??? Selective cherry-picking is what you are demonstrating.

  2. Ruckweiler Avatar
    Ruckweiler

    Economically Disadvantaged?” Is this a code word for black students? I was a Florida High School teacher before 9/11 and many of my black students did nothing in class and would use the expression “why you actin’ white?” towards the few who were working hard. Don’t doubt for a second that this sad and destructive attitude exists here in the Old Dominion.

    1. “Economically disadvantaged” is a category used by the Virginia Department of Education. Any student who qualifies for a free or reduced-price lunch program is counted as economically disadvantaged.

      1. Ruckweiler Avatar
        Ruckweiler

        Thank you for the explanation. Unfortunately, this term is so often used, or a variation thereof, to describe black students.

      1. James Wyatt Whitehead Avatar
        James Wyatt Whitehead

        2015 is pretty dated now. So much has changed in this department.

        1. LarrytheG Avatar
          LarrytheG

          could not find a later but I suspect the percentage on a racial basis is still close.

          The point is that when it comes to economically disadvantaged, it includes a high percent of white kids also.

          1. James Wyatt Whitehead Avatar
            James Wyatt Whitehead

            For sure Mr. Larry.

  3. LarrytheG Avatar
    LarrytheG

    Want to thank Butcher was keeping it to economically disadvantaged rather than race.

    The data is clear – and we do have the data because it is required when using tax dollars for education.

    We do have a problem. Not just in Virginia but across the country. Most (not all) public schools just plain suck at educating kids who are economically disadvantaged. Only a few “celebrated” Charter school do it well , far more are no better than conventional public schools unless the charter is specific to that demographic – like Success Academies in NYC. Even then, they choose to not educate certain kids in that demographic either.

    There is an opportunity with Lab schools if the concept is not politicized which I don’t have high hopes for.

    When we fail with these kids, when we essentially abandon them, for all sorts of idiotic “reasons”, we do so at harm to ourselves in higher entitlement and incarceration costs.

    It’s a lose, lose.

  4. Dick Hall-Sizemore Avatar
    Dick Hall-Sizemore

    Thanks for this simple explanation. The results are not unexpected, but it is important to emphasize them.

  5. James Wyatt Whitehead Avatar
    James Wyatt Whitehead

    It is important to note that pre pandemic achievement levels were stagnant, near flat, with a slight decline in measurement the last couple of years prior to March 2020. Long climb ahead. Reduce gears.

    1. LarrytheG Avatar
      LarrytheG

      And I’d like to know what Youngkins plans are to address it. The ball is in his court now that he has pointed out the problem. Right?

      1. James Wyatt Whitehead Avatar
        James Wyatt Whitehead

        He has no plan Mr. Larry. He is running for president. After that win he plans to run for Geezus.

  6. vicnicholls Avatar
    vicnicholls

    Cranky is a retired lawyer? Never knew that one!

Leave a Reply