2021 SOLs Don’t Tell Us Much of Anything

by John Butcher

2020 was the first spring since 1998 without SOL tests in Virginia. Then came 2021, when participation in the testing was voluntary.

The VDOE press release says, “[2020-21] was not a normal school year for students and teachers, in Virginia or elsewhere, so making comparisons with prior years would be inappropriate.” The first line of the very next paragraph of the press release then quotes the Superintendent making a comparison: “Virginia’s 2020-2021 SOL test scores tell us what we already knew—students need to be in the classroom without disruption to learn effectively.”

Let’s look at some data and see whether they offer any principled implications.

But first: As we have seeneconomically disadvantaged students (“ED”) underperform their more affluent peers (“Not ED”) by around twenty points, depending on the test. This renders the school and division and state averages meaningless because of the varying percentages of ED students. Fortunately, the VDOE database offers data for both groups. Hence the more complicated analyses below.

To start, let’s look at the numbers of students tested by year for reading in Richmond and statewide.

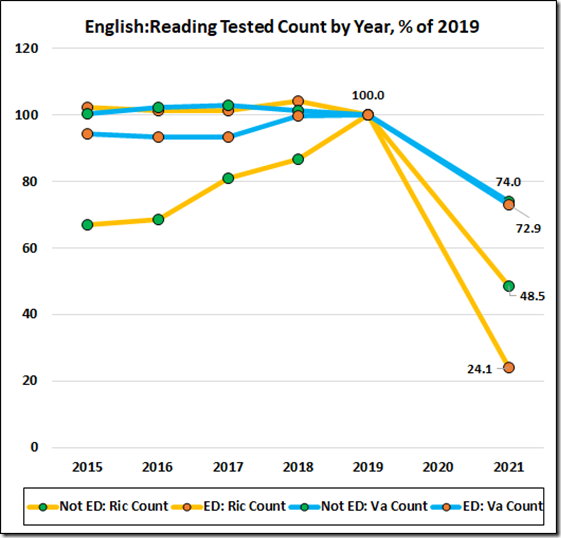
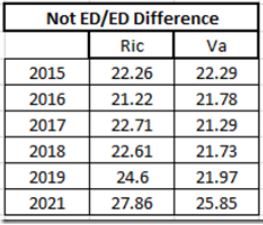
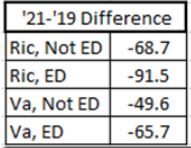
The Richmond ED score drop was nearly twice the state average; the Not ED, a bit short of 1.5 times.

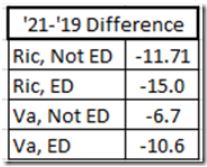
Note, however, that even a 6.7 point drop in the pass rate is huge.

We can only speculate about the effects of the various factors that might lie beneath these numbers. Those factors might include:

  • Quality of the online instruction
  • The students’ capability to learn online
  • Students’ efforts in the presence of an online teacher
  • Parental desire to see results for their children
  • Parental opposition to SOL testing
  • Parental concern for COVID exposure during the testing, and
  • Relaxed graduation requirements.

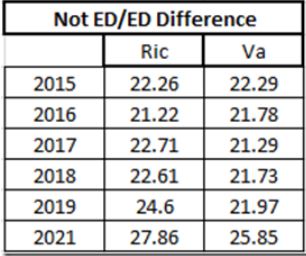
The ED/Not ED difference increased, both in Richmond, by 13.4% relative to 2019, and Virginia, 17.7%.

The math data suggest that, while they may wish that their little ones be tested in reading, many Virginia parents do not extend that wish to the math tests.

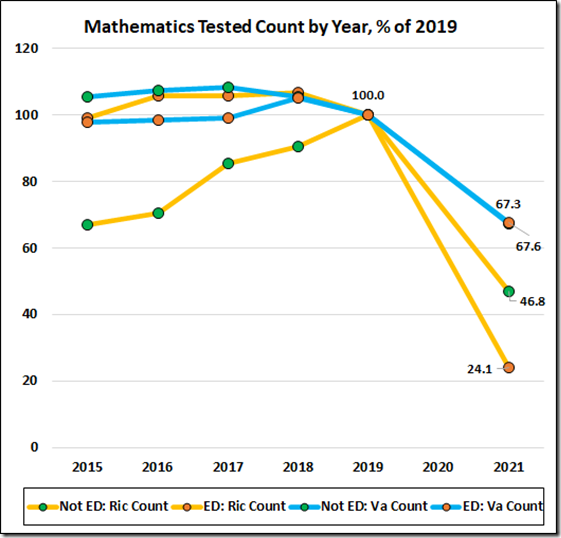
And, again, the Not ED/ED gap of those tested in ‘21 increased.

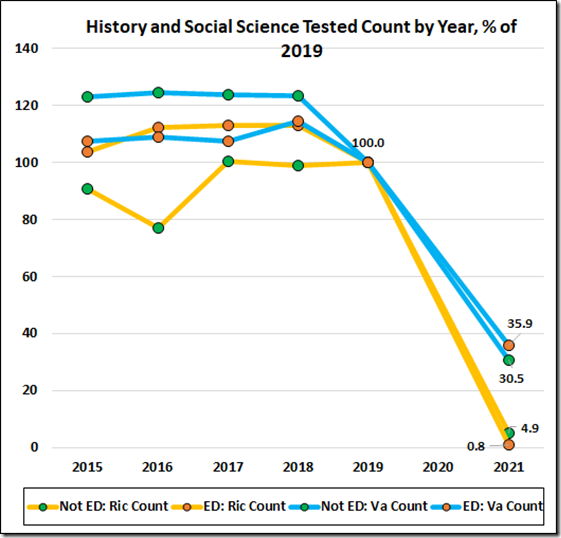
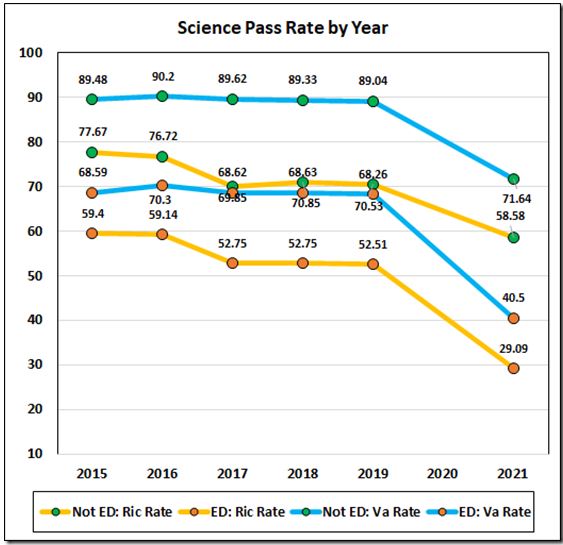
The H&SS test counts were so low that the pass rates must be close relatives of meaningless.

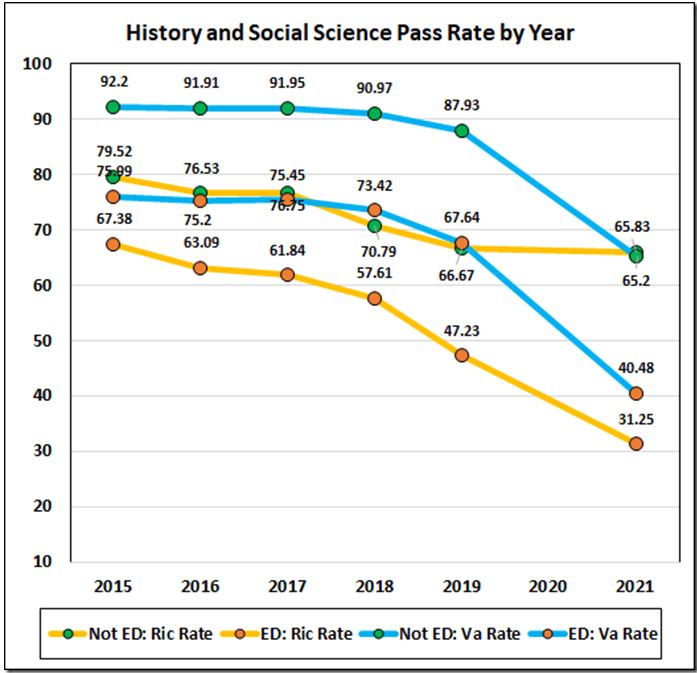
Hmmm. Even so, the Richmond Not ED pass rate edged above the state average.

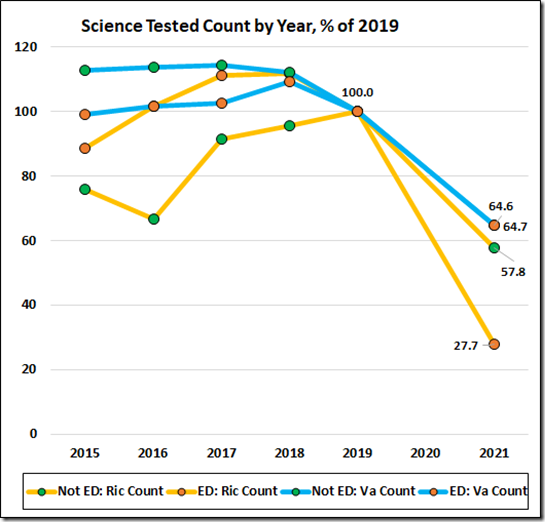
The science counts were close to the math numbers.

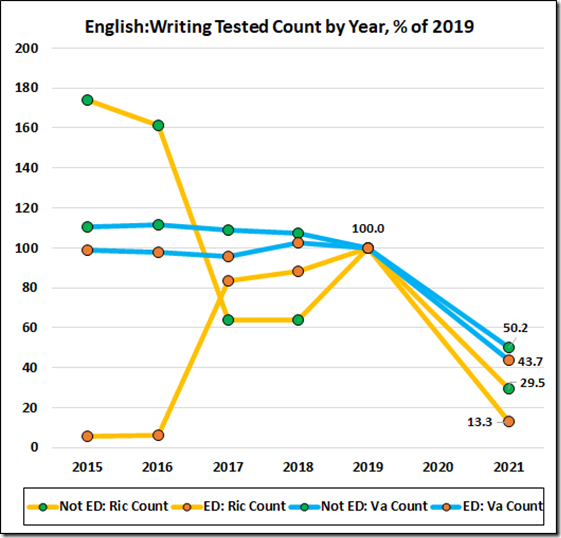
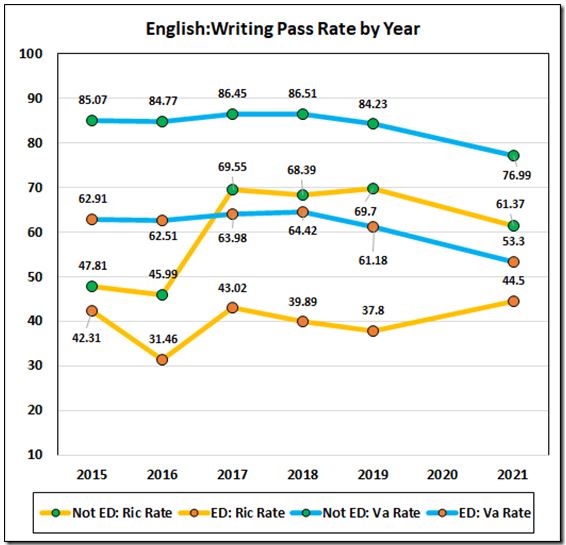
The writing data painted yet another messy picture.


There is one clear inference available from these data: The test results may well have been helpful to individual students but making the SOL testing voluntary made the collected results meaningless. Those collected results do not even give any measure of “what we already knew,” although they are not inconsistent with the notion that the online instruction did not work well. We’ll have to wait for the 2022 results to get a clearer idea of the COVID effects.

That’s enough for one post. It will take some time to mine the information in this year’s data; if you’re interested, please stay tuned.

Update: The original test count graphs published in this post were incorrect. They have been replaced with graphs showing the correct data.


Share this article


ADVERTISEMENT

(comments below)


ADVERTISEMENT

(comments below)


Comments

54 responses to “2021 SOLs Don’t Tell Us Much of Anything”

  1. John, I agree that we have to be careful using this data. We don’t want to compares 2021 apples with 2019 oranges. But….

    If we know that Economically Disadvantaged (ED) students consistently fail SOL tests at a higher rate than Not ED, and if we know that the decline in ED students taking the 2021 test exceeded the decline in Not ED students, it stands to reason that more low scorers dropped out of the test-taking pool than high scorers. Therefore, if anything, the gap in pass rates from 2021 test takers understates the gap in student population as a whole.

  2. LarrytheG Avatar
    LarrytheG

    Here’s what I read including more of what VDOE had to say and sounds very different from what JAB and Cranky’s “take”.

    I think this goes to the half-glass full – half glass empty perspective:

    ” Rather than measure school and division performance, the scores “establish a baseline for recovery from the pandemic,” the Virginia Department of Education said in a press release Thursday announcing the publication of the results.

    “What matters now is where we go from here, and we will use the data from the SOLs to identify the unique needs of every learner as our schools resume in-person instruction for all students,” Superintendent of Public Instruction James Lane said in the VDOE press release.

    Pass rates reflect the disruption in instruction students have experienced since schools were closed in March 2019. They also reflect declines in public school enrollment related to the pandemic during the 2020–21 academic year, and the larger number of parents who opted their children out of taking the tests this past spring.

    Statewide, only 75.5 percent of students took reading tests and 78.7 percent took math tests this past spring, compared with 99 percent taking both subjects in 2018–19.

    Tests were administered in reading and math to students in grades 3–8 and at the end of the course in Algebra I and II and Geometry. Science SOL test were administered to students in grades 5 and 8 and at the end of the course in biology, chemistry and Earth science.

    Of students who didn’t opt out, the statewide pass rate for reading was 69 percent. For math, it was 54 percent and for science, it was 59 percent.

    The 2018–19 pass rates for those three subjects were 78, 82 and 81 percent, respectively.

    The VDOE and local school districts are encouraging the community not to compare the new results with previous years or with those of other local districts, given the varying ways students were taught and attended school.

    “Last year was not a normal school year for students and teachers, in Virginia or elsewhere, so making comparisons with prior years would be inappropriate,” the VDOE press release states.

    Local results follow the same trends as the statewide results, with lower overall pass rates and steeper declines among Black, Hispanic and economically disadvantaged children and English learners.

    Declines were also steeper in math and science than in reading for all local divisions.

    Fredericksburg City Public Schools superintendent Marci Catlett said teachers will use the SOL scores to design plans to help students get back to where they need to be.

    “We have to individualize the way we approach this,” Catlett said. “Everyone is at a different point now in some form or another. We will be using these scores as baseline information and building from there to improve academic achievement, being responsive to the individual academic needs of all our students.”

    https://fredericksburg.com/news/local/education/fredericksburg-area-sol-scores-fall-sharply-during-pandemic/article_28d557bd-7aaf-5b06-8651-238a4b6e1bf2.html

    1. “The VDOE and local school districts are encouraging the community not to compare the new results with previous years or with those of other local districts, given the varying ways students were taught and attended school.”

      Of course VDOE and local school districts are discouraging people from comparing results. They want to hide their failure!

      Of course, they want to use 2021 as a new base-line. Next year can’t possibly be worse. They have to look better!

      Of course, you are willing to accept those argument because you will do anything within your power to avoid the implications of the god-awful results.

      1. LarrytheG Avatar
        LarrytheG

        no – it starts off this way:

        ” ” Rather than measure school and division performance, the scores “establish a baseline for recovery from the pandemic,” the Virginia Department of Education said in a press release Thursday announcing the publication of the results.

        “What matters now is where we go from here, and we will use the data from the SOLs to identify the unique needs of every learner as our schools resume in-person instruction for all students,” Superintendent of Public Instruction James Lane said in the VDOE press release.”

        The “failure” you allude to is pandemic-caused and has occurred to way more than just Virginia and VDOE.

        Yet you want to continue to hammer away at VDOE and Virginia even though Virginia ranks well nationally in normally times – but even then you are a critic.

        The results ARE Gawd-awful – no question about it but you want to blame … as if it did not need to be and it was the “fault” of public education and VDOE.

        Becaue your premise is we should have never closed schools to start with.

        And if Virginia was the ONLY state or one of very few and all others stayed open, did not have outbeaks and did fine academically, you’d be right.

        But that’s not what happened.

      2. In fact, it’s worse than that:

        The Superintendent says they’ll use the 2021 data “to identify the unique needs of every learner as our schools resume in-person instruction for all students.” That is nonsense (more likely a bald lie), given that there are no scores to identify the “unique needs” of the many students who were not tested.

        1. LarrytheG Avatar
          LarrytheG

          Right before that VDOE said this:

          ” ” Rather than measure school and division performance, the scores “establish a baseline for recovery from the pandemic,” the Virginia Department of Education said in a press release Thursday announcing the publication of the results.

          “What matters now is where we go from here, and we will use the data from the SOLs to identify the unique needs of every learner as our schools resume in-person instruction for all students,”

          Now, I read that to say that they’re going to give SOL tests to all kids to basically see how far behind the kids were and for every kid that takes that test, they ought to know.

          What am I not understanding?

          What are you advocating that they do instead?

  3. James Wyatt Whitehead Avatar
    James Wyatt Whitehead

    The line graphs are useful. From 2015 to 2019 we see no significant gains in testing across many subject areas. Flat and a general slide down until the crash of 2020. That demonstrates to me that McAuliffe and Northam have failed to move the needle in a positive direction. VDOE Superintendent Lane has failed to provide charismatic and institutional leadership. Local school boards and local school bureaucrats have failed or even regressed as seen in Richmond. The VEA and the local school teacher associations have failed to lobby for strategies to correct the slide.

  4. Steve Gillispie Avatar
    Steve Gillispie

    Again, kudos to BR for keeping the disaster of Virginia undergraduate education in the spotlight.

    Of course the schools should not have been closed. There are even states and localities which did not close their schools. Of course students should have been required to show their faces and otherwise certify that they were actually watching the courses. But this decision was so disastrous for the students and our society, the “useful idiots” will semantically pretzel themselves to defend it.

    What makes these numbers so much worse is the SOL results are a complete fraud. All public school curricula and administrative actions not devoted to non-triggering content, gender bathroom equity, and wokism– from lesson plan micro-interference to falsifying results — are geared toward making them look as good as possible.

    They didn’t tell the story of Virginia education before COVID and they will be even more fraudulent after COVID — count on the teacher’s unions and the administrators to see to that.

    This can not be corrected without a wholesale replacement of the education administrative hierarchy.

    Q.E.D.

    1. LarrytheG Avatar
      LarrytheG

      so… the idea of SOLs was considered a disaster even BEFORE covid, before we even knew about Covid, right?

      Then when COVID hit, how many public schools across the US stayed fully open the entire time without covid effects?

      The truth is that many, many school districts could not stay fully open including private schools.

      Further, the same folks that say they wanted schools to stay open were often opposed to mitigation measures and still are.

      Though Virginia needs to improve, especially for economically disadvantaged kids – we still do better than 40 other states of which the critics simply refuse to acknowledge.

      Finally, Steve points out that the US is outranked by other countries. Guess what, they’re all govt-run public education, not private schools and yes, quite a few of them also had to close after initially opening then having outbreaks. AND many of them required masks!

      I guess it all depends on one’s perspective, but not acknowledging simple facts seems to be a “thing” with the critics.

      I expect Virgina to come back on education and to resume it’s rank as one of the best school systems in the country.

  5. Steve Gillispie Avatar
    Steve Gillispie

    Butcher, Sherlock, Bacon, and others are doing yeoman work to expose the truth about the disastrous free-fall of educational quality in Virginia and US undergraduate education. Some commenters claim to have alternative facts or that the facts presented in these postings don’t make the case.

    Of course there are commenters here whose MO’s are to blizzard BR with oppositional, contrarian rhetorical confetti or just snide non-sequitors for whom no facts will get an acquiescence of credibility.

    For those still uncertain but with curiosity, how about another posting of some more facts, such as:
    1. What is the US ranking of educational results on a worldwide basis–I.e how high a bar is it to be ranked as one of the better US states, assuming Virginia is;
    2. What has been the effect of Virginia’s dumbing down the numbers of undergraduate success by expanding criteria to non-educational measures?
    3. What is the actual per cent of accredited versus non-accredited schools in Virginia?
    4. What is the average reading and math skills of the average high school graduate in the nation and Virginia?
    5. What is the drop-out rate from Virginia high schools?
    6. What is the per cent of students pushed to the next grade who did not meet the requirements for passing? Of that per cent what percent achieved that bump because of administrative mandates to reluctant teachers?
    7. Some data on the impossibility of creating successful instruction or even finding qualified teachers who will tolerate the disciplinary environment in inner-city schools where the worst can not be expelled, hopelessly incapable, challenged students must be mainstreamed, etc.
    8. Some data about the impossibility of any success for students in homes which can not support their children’s educational needs with the discipline, coaching, et al those of use who have endured this process with our own children well know.
    9. Parse out just how disproportionately this disaster is hitting those who the Literati and Liberal establishment clutch their pearls to opine are the victims of whiteness and systemic racism while aggressively causing inequity.
    10. Some statistics about the creep of administrative overhead and interference in the school systems sucking educational dollars from the classrooms and the salaries which should be going to actual teachers.

    The facts aren’t just ugly and disgraceful. They are socially suicidal.

    All of us are complicit in dooming our children and our nation to an unnecessarily compromised future by our acceptance of the debacle today’s public school system has become.

    BR, please keep this conversation going. Maybe even start a BLOG dedicated just to the havoc the US Education establishment is wreaking for our children.

    1. LarrytheG Avatar
      LarrytheG

      Bottom Line – Va is pretty good in the US and if compared internationally would compare BETTER than the US ranking worldwide.

      To not acknowledge that is disregarding facts.

      these are facts:

      6. Virginia
      The sixth-most educated state in the U.S. is Virginia, which ranks seventh for Educational Attainment and eighth for quality of education. Virginia has the fourth-highest percentage of graduate or professional degree holders in the country at 16.1%.

      https://worldpopulationreview.com/state-rankings/most-educated-states

      We do have issues especially with economically disadvantaged kids but Virginia sends a high number of kids to college compared to many other states.

      Conservatives have a problem acknowledging facts and instead want to focus on gloom & doom, not because they actually care about education but they want to assign blame for the “failures” on progressives.

      Same old Same Old partisan farting in the wind.

      1. Steve Gillispie Avatar
        Steve Gillispie

        LOL!
        Keep layering it on, Larry the … Your rhetorical flatulence–to use a metaphor you apparently understand–disguised as comments on this subject, “out” you as someone uninformed and not serious about either the problem or a discussion.
        That, of course, is your MO in almost all your comments.

        1. LarrytheG Avatar
          LarrytheG

          facts are facts Steve. It’s not my opinion.

          The stuff you peddle is simply not the truth – it’s pure partisan BS.

          It’s seems to be the MO of some (not all) Conservatives this day and you basically are peddling lies on this issue.

          You guys APE each other on this in fact.

          Virginia is in the top 10 states for K-12 education. That’s the simple truth you will not acknowledge.

          All the other crap you’re peddling is pure partisan BS.

          1. Steve Gillispie Avatar
            Steve Gillispie

            “All the other crap you’re peddling is pure partisan BS.”

            LOL! LOL! Give us some more of your learned, thoughtful and non-partisan rebuttal.

            However, Virginia’s national standing is irrelevant to this discussion.

          2. LarrytheG Avatar
            LarrytheG

            It sure as hell is if you’re serious about your criticisms.

            And the thing is -you’d have NOTHING if VDOE did not require SOLs AND report the results.

            You get your data from VDOE and while you Conservative types seems to love to not trust the GOvt , you apparently DO TRUST VDOE SOL data. 😉

            Partisan BS blather… guy..

    2. As a general rule, I do not read comments which appear to have more words in them than the original article/posting, but I made an exception for this one and it was worth it. If I could give you two up-votes I would.

      PS- I have learned the hard way that making that exception for some people’s comments is not worth my time.

      1. Steve Gillispie Avatar
        Steve Gillispie

        Neither do I. But I have been following this decline for 30 years with ever-increasing dismay. My entreaties at even my own dinner table have been met with disdain and mockery from all sides of the ideological spectrum.

        For so long our public school system which we invented was a standard the rest of the world couldn’t touch. It’s just too much of a shock for most Americans for whom the decision makers have well isolated their children to get their heads around how far we’ve fallen.

        Our oppositionally verbose commenter’s wrong and tragic redirection and ignorance is what you get from all sides of the political spectrum. This is probably because it’s not their children being intellectually crucified on the alters of Liberalism and the anti-capitalist academic class.

        For the lucky ones their education is nearer but far from the top in international comparisons.

        1. LarrytheG Avatar
          LarrytheG

          Interesting that Steve does not want to compare Virginia to other states (irrelevant) but he does to other countries…

          hmmm….

          and his premise that we were once better than now is also a myth:

          https://www.washingtonpost.com/blogs/answer-sheet/post/why-us-cant-get-back-to-head-of-the-class-because-it-was-never-there/2012/07/01/gJQAwpgAHW_blog.html

  6. OOPS!!!

    I made a mistake in the counts in the original post. As well, some of the charts in that post did not make it to Jim’s repost.

    Please see the complete, corrected post: https://calaf.org/?p=8481

    1. LarrytheG Avatar
      LarrytheG

      Cranky – you say this:

      ” But first: As we have seen, economically disadvantaged students (“ED”) underperform their more affluent peers (“Not ED”) by around twenty points, depending on the test.

      —>>> This renders the school and division and state averages meaningless because of the varying percentages of ED students.

      Fortunately, the VDOE database offers data for both groups. Hence the more complicated analyses below.

      THEN THIS —>>> To start, let’s look at the numbers of students tested by year for reading in Richmond and statewide.”

      So I’m confused. You seem to be saying that the scores averages are “meaningless” because of varying percentages..

      then you go right to RIC and State averages…

      what am I not undersanding?

  7. Matt Hurt Avatar
    Matt Hurt

    Observations from the field:

    1. The school accreditation accountability system in Virginia provides a great incentive for school folks to ensure students try their best on the SOL test. Nobody wants folks from Richmond (the Office of School Improvement) to kick in the front door of the school and make them do things they would rather not do because their school failed to meet full accreditation. This incentive was removed in the 2021 school year. Many folks looked at this as “let’s just get it done”.

    2. Due to the above as well as the rigmarole surrounding Covid safety protocols, far fewer expedited retests were administers last year. Keep in mind that this has been in place for a long time at the high school level, and since 2015 in the elementary and middle grades. Any student who gets a score of 375-399 (400 is passing) gets a do-over, and many of those kids pass their second attempt. In the pass rate calculations, the initial failing attempt for these kids who pass their expedited retake is expunged and only their passing attempt is counted.

    3. When you review the vertical progression of skills in Virginia’s mathematic SOLs, everything from year to year is new. Certainly the new skills build on the old, but it’s still new. When you look at the vertical progression of skills in reading, much of those skills are carried over from the previous year. In other words, if instruction is disrupted, one would expect reading scores to suffer less than math scores.

    4. The Board of Education dropped the cut scores for pass proficient (the number of items a student must get right to pass) on the math SOL tests in 2019. That year, there was a big jump in pass rates, not because our kids became more proficient, but because we lowered the bar and more kids could step over it than would have previously. The Board of Education lowered the cut scores on the reading SOL tests this spring (which was the plan even before the Pandemic). This means that a student had to evidence a greater degree of mastery to pass the 2019 reading tests than the 2021 reading tests.

    5. When students are “participating” in online instruction, teachers do not have proximity control of the students to ensure that they do their work, and to ensure that their work is actually their work, and not the product of new and innovative ways to cheat. Many of our parents lack the capacity (time, interest, understanding of the process, patience) to ensure their kids do what they are supposed to do. Quality of online instruction therefore cannot be accurately measured, because student compliance is either a factor of the student’s self discipline (which is in very short supply among kids) or the parent’s willingness and ability to force their kids to do their work without cheating. In fact, many assignments that were submitted were completed by parents who found it easier to do the assignment themselves rather than fight with their kid to do it.

    It is extremely important to consider these factors when one evaluates these results if you want to arrive at any valid conclusions. In my honest opinion, this data is not hardly worth the paper on which it is printed.

  8. Nancy Naive Avatar
    Nancy Naive

    It’s not clear SOLs tell us much of anything regardless of year.

    1. Matt Hurt Avatar
      Matt Hurt

      I argue that the 3-8 reading and math results are fairly useful. Without a basis in literacy and numeracy, our kids don’t have a shot at many opportunities, and these tests do a decent job of measuring those skills. However, they can certainly be improved. One extremely useful upgrade would be a means by which to obtain nationally normed scores, which would eliminate the Board of Education’s impact on outcomes by simply messing with the expectations.

      1. James C. Sherlock Avatar
        James C. Sherlock

        That matches my own experience.

        As an aside, math is the biggest gap as measured by the spring SOLs.

        The good news is that math may lend itself to remediation better than any other subject.

        Since current educational thinking apparently rejects retaining kids in a previous grade at scale (I plan to write about that), the schools will need to offer their teachers the resources to isolate some students for remedial drills while proceeding apace with the rest of the class. Volunteer tutors can do some of that.

        As a volunteer tutor, I found it very efficient and effective to repeat simple 3rd grade math drills – in this case timed quizzes on multiplication tables after assigning the homework on those tables – to fill baseline learning gaps in fifth graders. It worked in a few weeks of 15 minutes three times a week. Good thing. Nothing in the math syllabus beyond third grade can be mastered if a kid can’t multiply.

        I see a similar situation in geometry and trig. Kids can fail at geometry and trig because they had never mastered algebra. Additional drills in algebra may help kids a great deal before those classes.

        Not a panacea, but such approaches can help.

        What are the approaches to math remediation in your school systems Matt?

        1. Matt Hurt Avatar
          Matt Hurt

          Our most successful teachers of our most at-risk students simply pull kids outside of class (usually during their own planning period) for additional instruction the moment they detect the student is having a problem. These teachers get mostly economically disadvantaged students, plus all of the students with disabilities in their grade, but despite that, turn out phenomenal SOL outcomes. It’s really not rocket science, they just fill the learning gaps the kids have when they’re evidenced.

          1. LarrytheG Avatar
            LarrytheG

            If you look at the bigger school districts like Fairfax and Henrico – they have both some of the best schools in Virginia and some of the worst where some of those school serve predominately low income neighborhoods and many of the kids are economically disadvantaged. So we have the same administrators for the entire school district – presiding over some of the best and some of the worst schools.

            What is the problem with the low performing schools?

            Is it bad aminisrators? bad teachers? bad parents or inferior kids who can’t learn?

          2. Matt Hurt Avatar

            I believe it is an expectation issue of the leadership. For example, when I worked in Wise County, if a principal evaluated a poor performing teacher as satisfactory, the principal received an unfavorable evaluation.

            Poor school performance cannot be laid at the foot of teachers. In many instances, you can go into these schools and you’ll find that all most all of the teachers (if not all) get very favorable evaluation ratings at the end of the year. If that happens for just one year, shame on the principal. If that happens more than one year, shame on the central office.

          3. LarrytheG Avatar

            So how would anyone else besides the principal KNOW the teacher was poor performing and the principle lied?

            Also – I’m not sure that issue really explains why, for instance, in Henrico County where JAB lives but seldom if every alludes to in these dicussions – why it has some of the best schools in Virginia AND some of the lowest performing , no better than some of the schools in Richmond.

            So if Richmond has terrible leadership and bad teachers, how do we describe the leadership in Henrico and the “disparity” between good performing teachers at it’s good schools and low performing teachers at the low performing schools?

            How does that happen and why is it not uncommon at all in large schools districts – even Fairfax and Loudoun?

            Why are some schools in districts with high performing schools while others in the same district are low performing?

          4. Matt Hurt Avatar

            I’ll give you an example of evaluations not aligning with performance. In one division a few years ago, the vast majority of teachers who received an exemplary rating (the highest available rating) on their evaluations produced pass rates below the state expectations for school accreditation. In other less well funded divisions that had higher rates of poverty, this was not the case. If the student outcomes are not acceptable, but the evaluation is proficient, then everyone assumes that the unacceptable outcomes are in fact acceptable.

            It all boils down to expectations. I bet you any amount of money that you’d care to put up that in poorer performing schools, grades don’t align with SOL performance and evaluations (teacher and principal) don’t align with SOL performance as much as they do in higher performing schools.

          5. LarrytheG Avatar

            So, here’s my problem (and I’m not doubting your own direct experience).

            If what you say is true in your experience, is the same thing going on in a bunch of other school districts including the ones like Henrico which have both high performing and low performing schools in the same district.

            Are all the low performing schools in Henrico due to the practices you are alluding to? So the same administrators in Henrico that preside over the high performing schools are also engaging in low expectations for all the low performing schools?

            And not only in Henrico, but Fairfax, Loudoun, Chesterfield, etc.. virtually everywhere, there are larger school districts that have both high performing and low performing schools?

            Is it like a fairly uniform and widespread institutional practice?

            None of these school districts actually want to hold the lower performing schools – principals and teachers actually accountable?

            Again, I’m not disbelieving you but it sorta sounds like a pretty widespread practice…

            Finally, if you were an administrator in one of these large school districts with this issue – what would you advocate to fix it?

            Thanks, as usual, for all of your very reasonable comments here – they are much appreciated.

          6. Matt Hurt Avatar

            I haven’t seen their data, but I would bet the farm that this is the case.

          7. LarrytheG Avatar

            What data would you have to see to confirm your thinking?

            What data would indicate teachers in low performing schools not being held accountable?

          8. Matt Hurt Avatar

            Again, I have not seen this in the schools you have mentioned, but I see it everywhere I have been, and I’ve been in a lot. Very consistently, in low performing schools, it is exceptionally easy for a student to get an A and a teacher to get a good evaluation rating while the school is in a perpetual state of improvement due to poor SOL outcomes.

            Much of this is related to the culture of the school. Everyone thinks that’s as good as their kids can do, and they don’t believe that can change, so the status quo continues. In my experience, the root issue is expectations, or lack thereof 100% of the time.

          9. LarrytheG Avatar

            I hear you. But it sounds like the Administrators at a crap-load of schools from Fairfax to Henrico are doing the same wrong thing… even as they also have very higher performing schools under their leadership.

            So the Administrators are accountable for this?

          10. Matt Hurt Avatar

            Yes.

          11. LarrytheG Avatar

            Have had long conversations with both active and retried teachers about these issues and at least one view did resonate, and that is that at most schools, the goal is to get as many kids as possible to achieve the SOL standards, no matter their SES – socio-economic status). Then they work to get as many of the lower SES (also referred to as economically disadvantaged) to pass, but it’s a more difficult effort that takes more time and resources and often not enough of either if there are larger numbers of them.

            But the first cut is to get as many on-grade level and SOL capable – the harder cases get addressed with whatever is left after the first group is taken care and with whatever additional resources like Title 1 are available).

            And the reason for that is pretty simple, that’s how you stay in good graces with the administrators, deliver “good” aggregate school level SOL numbers, etc. The “gap” is not the priority and if someone makes it a priority, and it comes at a cost to overall School SOL numbers, heads will roll.

            This does not sound like the way that things work in our neck of the woods.

          12. Matt Hurt Avatar

            If resources are a significant factor, how then does the least well funded region in the state on a per pupil basis, with the second highest rate of poverty, produce the greatest rate of proficient students?

          13. LarrytheG Avatar

            You know the answer better than I do, but there are several reasons, some of which are somewhat endemic to rural areas.

            And not all schools in suburban and urban areas do as poorly as other areas.

            As both you and James W point out, a lot has to do with the folks at a particular school – a good principal with a seasoned staff can perform better.

            In big school districts where recruiting is an issue, they tend to hire newbies and send them to schools not yet fully staffed, which are sometimes schools that existing teachers do not want to be at because of what they have heard about that school and principle.

            I don’t think what you do with rural schools is as easy to do with bigger school districts but would want to hear your view.

          14. Matt Hurt Avatar

            I do think that many urban areas in Virginia suffer from an endemic concentration of utter poverty. In the more rural areas, the poverty is more prevalent, but it is spread out. There is a smaller gap between haves and have nots. In the urban centers in Virginia, folks who live in poverty are crammed together like sardines in a relative small area, not so far away from folks on the opposite end of the economic spectrum.

            Divisions that have a big gap between the haves and have nots must put a lot of blood, sweat, and tears into the children of the haves so that they do not take their children elsewhere, because they know they have the means to do so. Organizations can do one thing really well, and more things less well. The more critical missions an organization has, the less effective it can be. If they’re focusing on the doctors’ and lawyers’ kids, who is loosing out? The bad thing about the kids of the have nots is that they don’t have the luxury of the choice of schools.

            I have read some on high concentrations of poverty, and none of it is good. This tends to bring with it a host of social ills, and many of these maladies work their way into public schools, making it more difficult for educators to accomplish their mission. One of the more pernicious ills this breeds is that of low expectations.

            Tennessee in large part serves as a stark contrast to Virginia in this manner. In Tennessee, usually the higher performing areas are urban (with the notable exception of Memphis), and the lower performing areas are rural. When I first found this out, it really rocked me at my foundations.

            While I don’t know exactly why this works our in a very different manner in Tennessee relative to Virginia, it does seem to me that in Tennessee has a generally more pragmatic outlook on such things. They seem to have done a better job in some ways at holding folks accountable for outcomes, even though their state accountability is nothing more than the federally mandated federal accountability system.

            In Virginia, we have taken a more indirect approach. For example, it seems that in Virginia, rather than dealing with the problem head on (this subgroup of kids is not performing to expectancy, these folks over there have figured it out better than anyone else, let’s find out why they have been successful and work to replicate it everywhere else), we’re attacking unmeasurable systemic issues that may/probably do not have a high correlation with student outcomes. If the system is responsible, we’re doomed, because the system is not accountable.

            Some examples of this are our current plan to ensure equitable outcomes. We have reduced the accountability for student outcomes of teachers and administrators by reducing the degree to which student outcomes figure into the evaluation system. We have reduced the expectations of student achievement by significantly lowering the cut score for pass proficient on our reading and math SOL tests. It seems like the premier strategy that has been put into place to ensure more equitable outcomes is equity training for teachers and administrators. When we lower accountability, lower expectations, and rely less on the outcomes and more on the inputs, I do not expect things to get better.

          15. LarrytheG Avatar

            I agree with a bunch of what you say. But I would point out that even places like Fairfax has a significant number of economically disadvantaged kids a does places like Henrico where JAB lives.

            And these kids tend to be grouped by the neighborhoods they live in , they do not typically live in the high end neighborhoods individual schools tend to be allocated by neighborhood so that the higher end neighborhoods will not only have lower numbers of economically disadvantaged but will also be staffed with the better teachers and good teachers do get choice of what schools to teach at and newbie teachers and lower-performing often get relegated to the schools that have lower performing kids and other issues.

            I dunno much about Tennessee but wonder how it compares on a state level https://uploads.disquscdn.com/images/c2ca73eb143758c4f111c18d4fade52b6b383d930dcb60c358dd547bdeb39472.jpg https://uploads.disquscdn.com/images/aa89706aeb8ac0423bc5eaeb3340b5a04a51571670dff82e58d72d76ea68b8b0.jpg https://uploads.disquscdn.com/images/c2ca73eb143758c4f111c18d4fade52b6b383d930dcb60c358dd547bdeb39472.jpg with Virginia.

      2. LarrytheG Avatar
        LarrytheG

        re: “nationally normed scores”

        How about NAEP ?

        1. Matt Hurt Avatar

          I am concerned about the sampling method used by NAEP. I have contacted them, and they don’t control for the variances in outcomes by region. Another problem is that they don’t assess every student, and the data is not reported by school and division. This assessment is a means by which to assess the state educational program, but does not get more granular.

          1. LarrytheG Avatar

            Yep – I don’t disagree and I think the same might be true of PISA with how academic performance is measured in other countries.

            But if you go to the https://nces.ed.gov/nationsreportcard/studies/statemapping/

            They say they are aware of that issue and normalize the data with various methods such as choosing different schools for testing than prior tested.

            NAEP seems to use very granular criteria to determine proficiency.

            If we discount/doubt NAEP then what other methods are available for comparing states as well as comparing the US on PISA? I thought both were predicated on NAEP testing? No?

          2. Matt Hurt Avatar

            No sir, the PISA is a different test.

            If we replaced our SOL tests in Math and Reading with assessments that yielded nationally normed results, or developed a methodology to reliably provide nationally normed scores on our current SOL tests, that would help a bunch.

          3. LarrytheG Avatar

            Do we actually give PISA in our schools?

            I thought we gave NAEP and then mapped those results to PISA. No?

            My understanding of NAEP is that they not only use different schools from year to year but that they don’t test all students, they do randomized demographic sampling… not all the kids.

            If NAEP gives NAEP tests (not state standardized) to randomized samples, in the states, are they not comparable?

            https://nces.ed.gov/nationsreportcard/students/

          4. LarrytheG Avatar

            So, PISA tests are actually administered directly to US students – as well as NAEP assessments?

            I’ve seen verbiage on VDOE and school districts about NAEP assessments but never for PISA… and thought that NAEP assessments were mapped to PISA.

            Would you have a link to a school or school district or VDOE that alludes to PISA testing?

            thanks

          5. LarrytheG Avatar

            Thanks. It sure looks like it but I’ve searched VDOE and other to see what schools in Va gave PISA tests – and whether to the whole school or randomized demographics, etc and have found none.

            Do you know of specific schools in your area where PISA assessments have been given and where those results reported?

            I see this also: https://www.washingtonpost.com/local/education/virginia-may-get-own-results-in-2015-pisa-test/2013/12/03/91fac27e-5c2d-11e3-be07-006c776266ed_story.html

            but see little if anything on what schools did the testing… and how and results.

            Seems like that data would actually show how Virginia actually ranked on PISA to other countries, right?

            I also see this which is where I got the idea of “mapping” instead of separate testing:

            https://nces.ed.gov/timss/pdf/naep_timss_pisa_comp.pdf

            but reading this:

            https://nces.ed.gov/surveys/pisa/faq.asp#3

            it’s pretty clear that PISA assessments ARE given in the US but the number of schools and students is very small even compared to NAEP assessments.

            So there are REALLY some schools in Virginia that actually do give SOLs, NAEP AND PISA!!!

          6. Matt Hurt Avatar

            I’m not aware of any.

          7. LarrytheG Avatar

            I was clearly wrong about PISA being mapped instead of given but there is almost no information available about how PISA is given , to what schools and what the results are.

            If we had those results, we actually could compare Virginia to other OECD countries…

      3. Nancy Naive Avatar
        Nancy Naive

        Well, can’t fully disagree since my K-12 cohort was subjected to several standardized tests, and well, we were the workforce that got us to where we are, plus to Mars and the Moon and back. But those tests were for the benefit of directing the student, not system evaluation. Just not sure you can evaluate the system.

        To presume that the SOLs have value, you start with the assumption that the material AND the timeline in which that material is taught is worthwhile.

        For example, I’ve seen 18- and 30-year old college students learn, retain, and understand in just one semester the subject material their K12 experience spent years teaching. Timing is everything.

  9. LarrytheG Avatar
    LarrytheG

    Before we go off on another misguided and simply untrue blame game narrative – there are some basic facts about academic performance in Virginia as well as the USA over the last 50 years.

    1. – VDOE created the SOLs that mandated these tests and also mandated the collection and reporting of the test data that critics like JAB and Cranky then use to regularly impugn public education as well as VDOE.

    2. – Before VDOE instituted the SOLs standardized tests , how was academic performance of Virginia schools reported? Do the VDOE critics even know?

    3. – VDOE did not cause the pandemic, nor close the schools. it’s primary role is to maintain the SOLs and help guide schools in finding out how far behind the kids are and doing the things that are necessary to get them back up on grade level. Not exactly something to assign “blame” for unless you’re just a relentless critic with really not much else to offer.

    Finally, contrary to Steve G belief that we had better and higher academic achievement than other countries in the past, here is what I’ve found in my reading:

    – there are many sources to verify the following facts:

    ” The Standards of Learning (SOL) have provided a foundation for increased student achievement for nearly two decades. The standards are at the core of a statewide system of support and accountability that has helped make Virginia’s public schools among the nation’s best.

    Origins of reform

    While the term “Standards of Learning” dates to the early 1980s, what Virginians today regard as the SOL program began in the mid 1990s in the wake of several ineffective attempts at reform and dramatic declines in the achievement of Virginia students on national assessments.

    In 1994, the reading scores of Virginia fourth graders on the National Assessment of Educational Progress (NAEP) plummeted. This jolt, coupled with a decade of declining SAT scores, lead to a bipartisan consensus around the need for more rigorous academic and instructional standards in the Commonwealth’s public schools. ”

    https://www.doe.virginia.gov/boe/reports/annual_reports/2013_appendix_a_sol_history.pdf

    And here is some history of the US K-12 prior to the era of SOLs:

    ” Twentieth Century Assessments of Math and Science Achievement

    “In 1965, the Association for the Evaluation of Educational Achievement (IEA) conducted a study of mathematical achievement in 12 countries. Students were asked to solve 70 problems. Among math students, the top scoring countries were Israel (a mean score of 36.4 correct items), England (35.2), Belgium (34.6), and France (33.4). U.S. students placed last, with a mean score of 13.8.

    The IEA conducted an international assessment of mathematics during the 1981-82 school year. Twelfth-grade students were assessed on six topics: number systems, sets and relations, algebra, geometry, elementary functions and calculus, and probability and statistics. Hong Kong students scored best, Japan was second, and the United States ranked last among advanced industrial countries.”

    https://www.iea.nl/about/org/history

    https://www.washingtonpost.com/blogs/answer-sheet/post/why-us-cant-get-back-to-head-of-the-class-because-it-was-never-there/2012/07/01/gJQAwpgAHW_blog.html

    I’d be interested in having Steve provide some links to the reading he has done that has led to his beliefs about this – something more than insults and Ad Hominems which seem to be the common thread with Conservatives in BR when they disagree.

  10. LarrytheG Avatar
    LarrytheG

    I still think it’s way premature to give up on virtual.

    I point out several commercial outfits like k12.com and Virtual Virginia and even Liberty University which has a virtual K-12 program.

    There on kids in rural Virginia that may not have access to higher level classes except through virtual.

    There are home-schoolers and private schoolers that can get access to courses that their parents can’t help them with or are not offered in the private school.

    Finally, I bet dollars to donuts that manh Asian kids do fine at virtual. I’d like to see THAT data!

Leave a Reply