
 This is the first of a series of four articles explaining Virginia’s Standards of Learning assessments, showcasing school districts have demonstrated success despite significant challenges, providing context for the 2021 assessment results, and expressing concerns about recent General Assembly and Board of Education actions that could have significant negative unintended consequences. Given the crucial necessity of producing well-educated graduates, it is vitally important that Virginia citizens understand how the assessments work. — Matt HurtVirginia has administered Standards of Learning (SOL) assessments for more than twenty years. Over that period, many changes have taken place through actions of the General Assembly and the Virginia Board of Education. According to the Virginia Department of Education, the purpose of SOL testing is to “inform parents and communities about whether students — as individuals and collectively — are meeting the commonwealth’s expectations for achievement in English, mathematics, science and history. SOL tests allow the state Board of Education to identify schools that need assistance and support. The assessments also provide an objective means for measuring achievement gaps between student subgroups and for determining the progress of schools, divisions and the state toward closing these gaps.”The SOL tests measure skills that are foundational to students’ success in future academic endeavors. I have yet to find anyone that could successfully argue these skills are not valuable or that student success in these skills is not desired. If students cannot read, interpret, and understand written text, or reason through mathematical concepts, they will not be able to access higher level courses and will be less well prepared for post-secondary education.In this series, I focus primarily upon critical reading and math SOLs. The history and science tests are less skill based and rely more on assessing student ability to recall discrete facts.The tests are criterion-referenced assessments designed to measure student proficiency relative to Virginia’s Standards of Learning (SOLs). These standards were first adopted by the Virginia Board of Education in 1995, and in 1997 the Board approved changes to the Standards of Accreditation that linked school accountability to the outcomes of assessments based on the SOLs. Prior to that time, the state testing programs consisted primarily of nationally normed assessments that measured a student’s achievement relative to his/her peer group from across the nation.Virginia has identified a progression of reading and math skills from Kindergarten through 12th grade. This progression assumes students have no academic background upon entering Kindergarten, and begins that grade with letters, sounds, and numbers. Each year, the skills are built upon the learning of the previous year. If competent instruction is provided, it is reasonable to expect students to master each grade’s skills within the course of one school year. If students fail to achieve proficiency, however, they fall into the at-risk category because they lack the prerequisite skills necessary to be successful in the next grade.According to Virginia Code § 22.1-253.13:1, the Board of Education is required to review the Standards of Learning every seven years. During this process, changes are typically suggested to and approved by the Board. When this happens, the SOL tests must be updated to correspond to the changes in the standards. As part of this process, the Board also must approve new cut scores (the number of questions that must be answered correctly to earn a pass proficient or pass advanced score). The Board accepts feedback from groups of teachers assembled for this purpose, as well as the state superintendent, then makes the decision. These changes in standards and cut scores have impacted pass rates, both negatively and positively.Early on, high school students who failed with a score of 375-399 (400 is passing) were afforded the opportunity to retake the test, as SOL tests are one of the criteria used to earn a high school diploma. In 2015, elementary and middle school students who failed within the same score range were also allowed an expedited retake. With the implementation of more rigorous math standards in 2012 and more rigorous reading standards in 2013, the SOL test also included Technology Enhanced Items (TEI) for the first time
. These items were not straight multiple select questions, but a question for which students would be required to select all the correct answer choices, drag labels to the correct position on a graphic, manipulate graphs, etc. TEI items are typically considered more difficult than traditional multiple-choice questions.
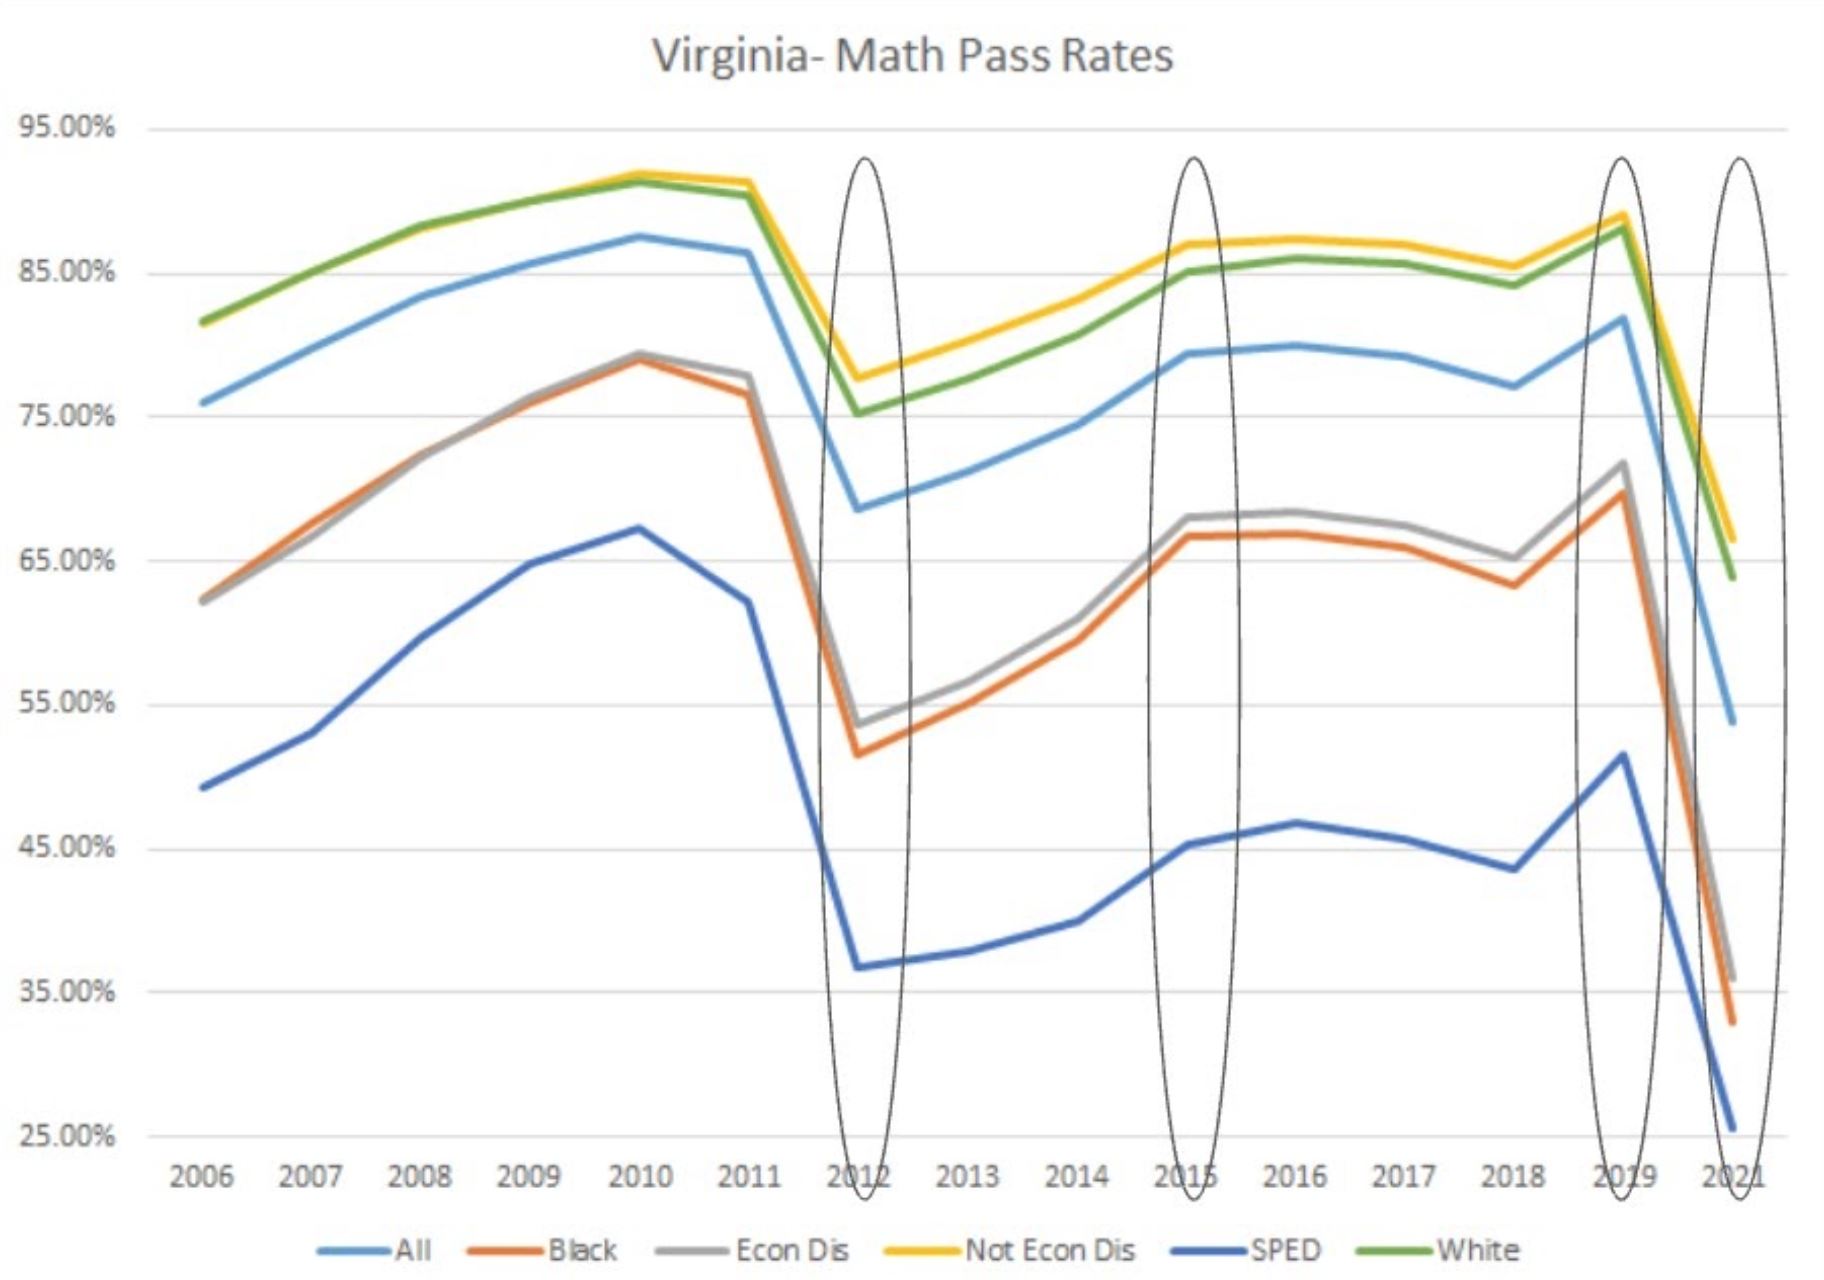
Figure 1 and Figure 2 below display how changes in standards, cut scores, and testing protocols have impacted SOL pass rates over time.
The first major dip in scores indicated in these charts reflected implementation of the more rigorous standards and TEI items in Math (2012) and Reading (2013). There was a significant increase in pass rates in 2015 that corresponded with the advent of expedited retakes at the elementary and middle level. In 2019, there was a significant increase in SOL pass rates, which corresponded with a new SOL test which had lower cut scores than the previous test. There was a much more significant decline in math pass rates in 2021 than in reading, in part due to lower cut scores for the new reading tests that were first administered that year. Of course, our educational response to the COVID pandemic played a big role in the 2021 outcomes, but that will be discussed in the third article of this series.

Given that Virginia’s SOL tests are criterion-referenced and that cut scores are to a certain degree arbitrarily decided by the Board of Education, understanding these outcomes requires context.
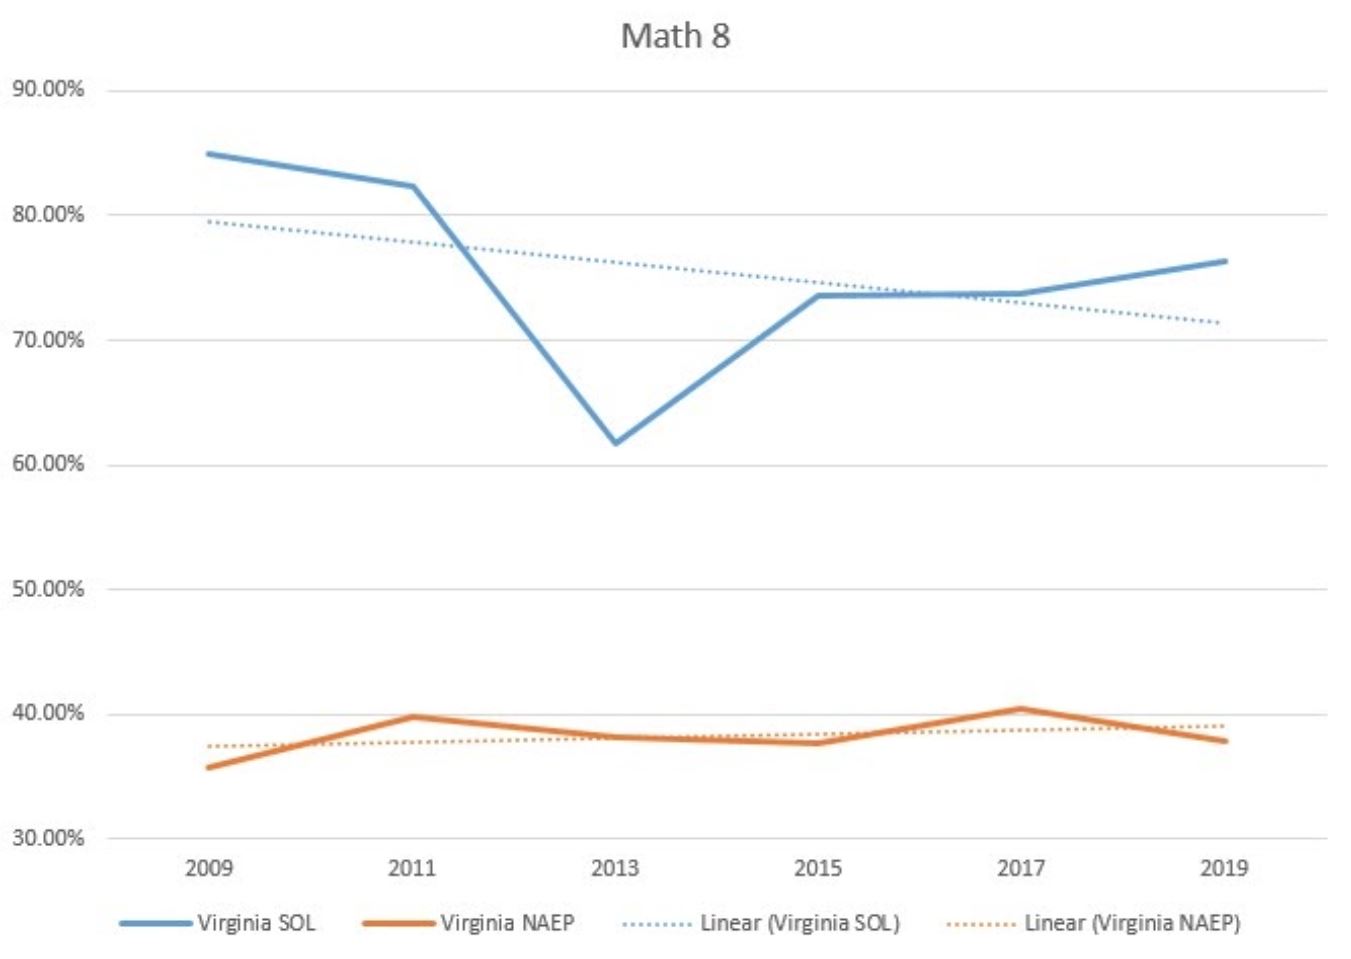
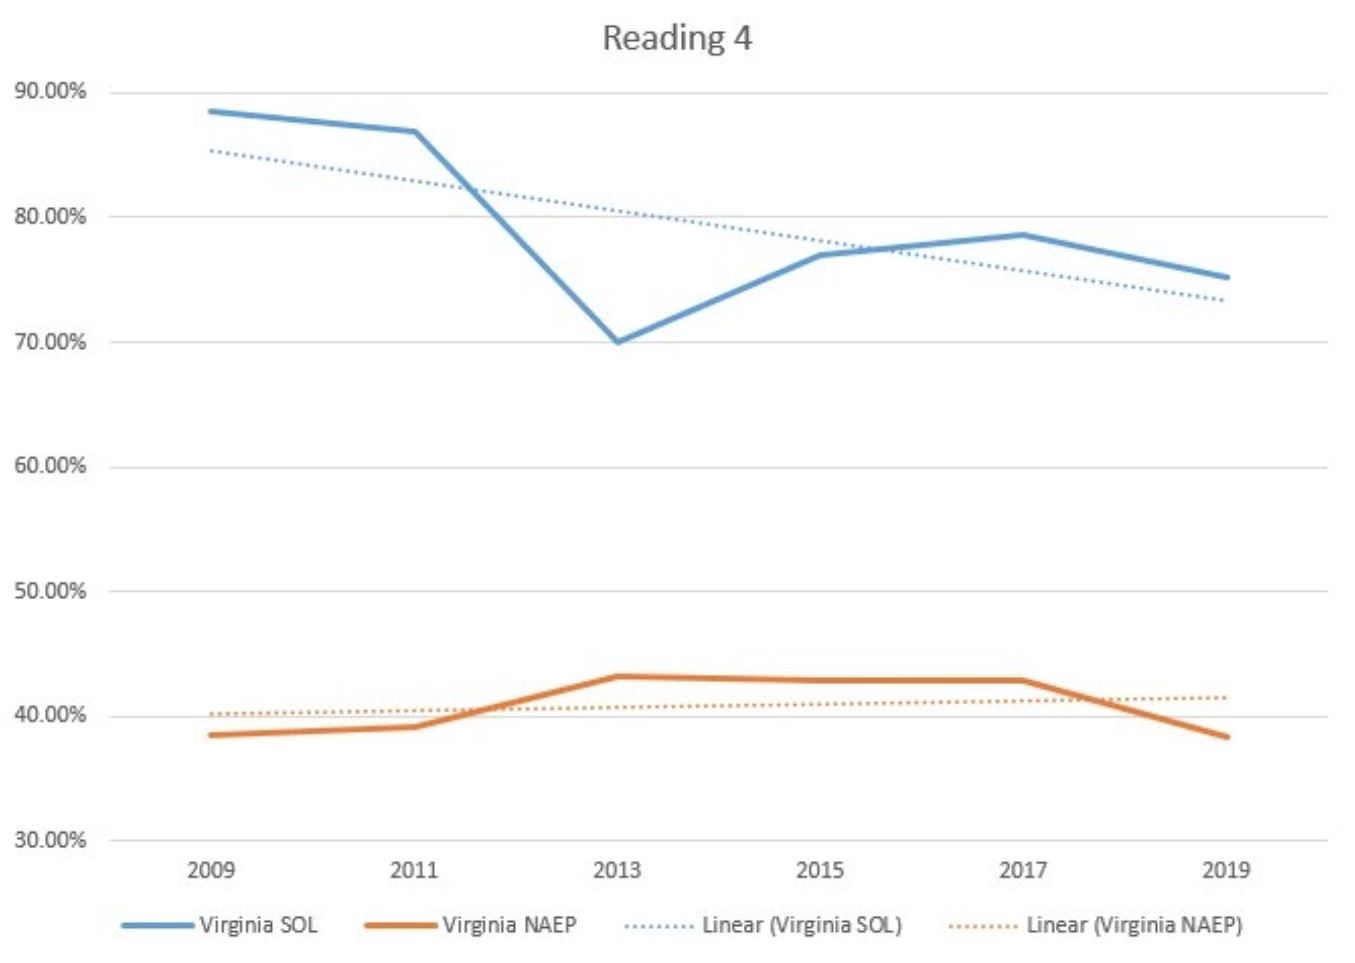
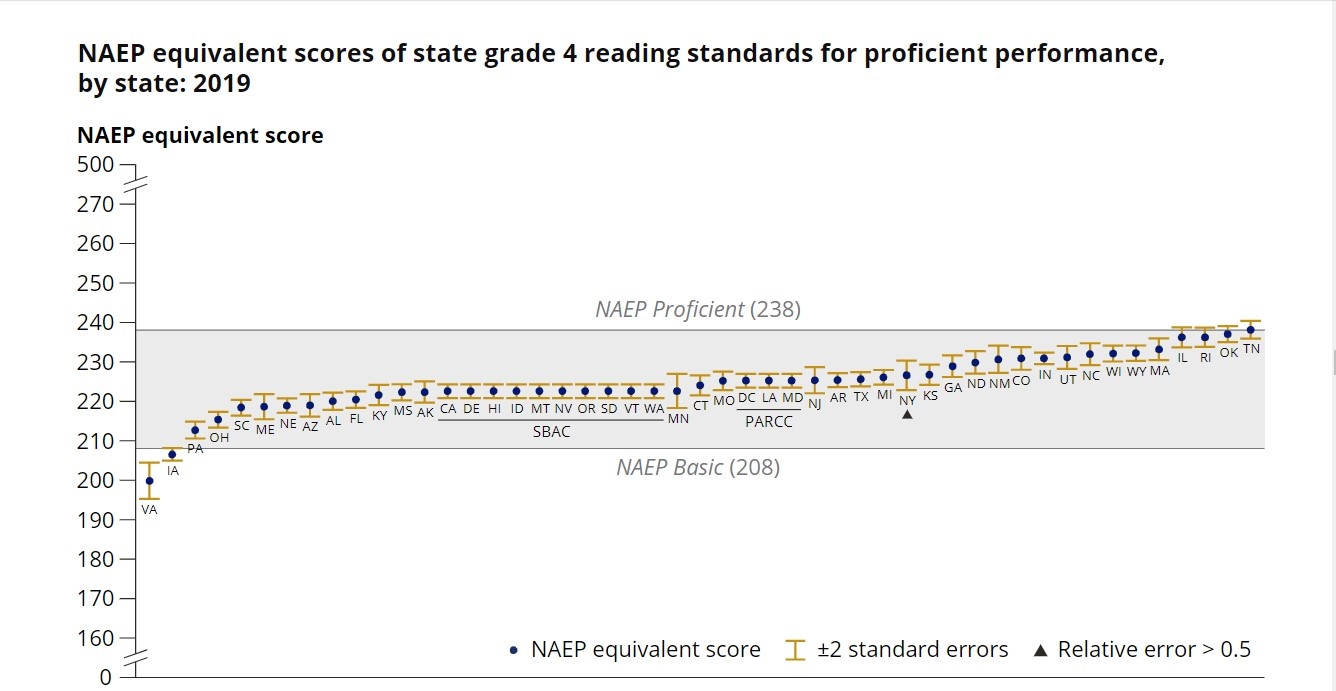
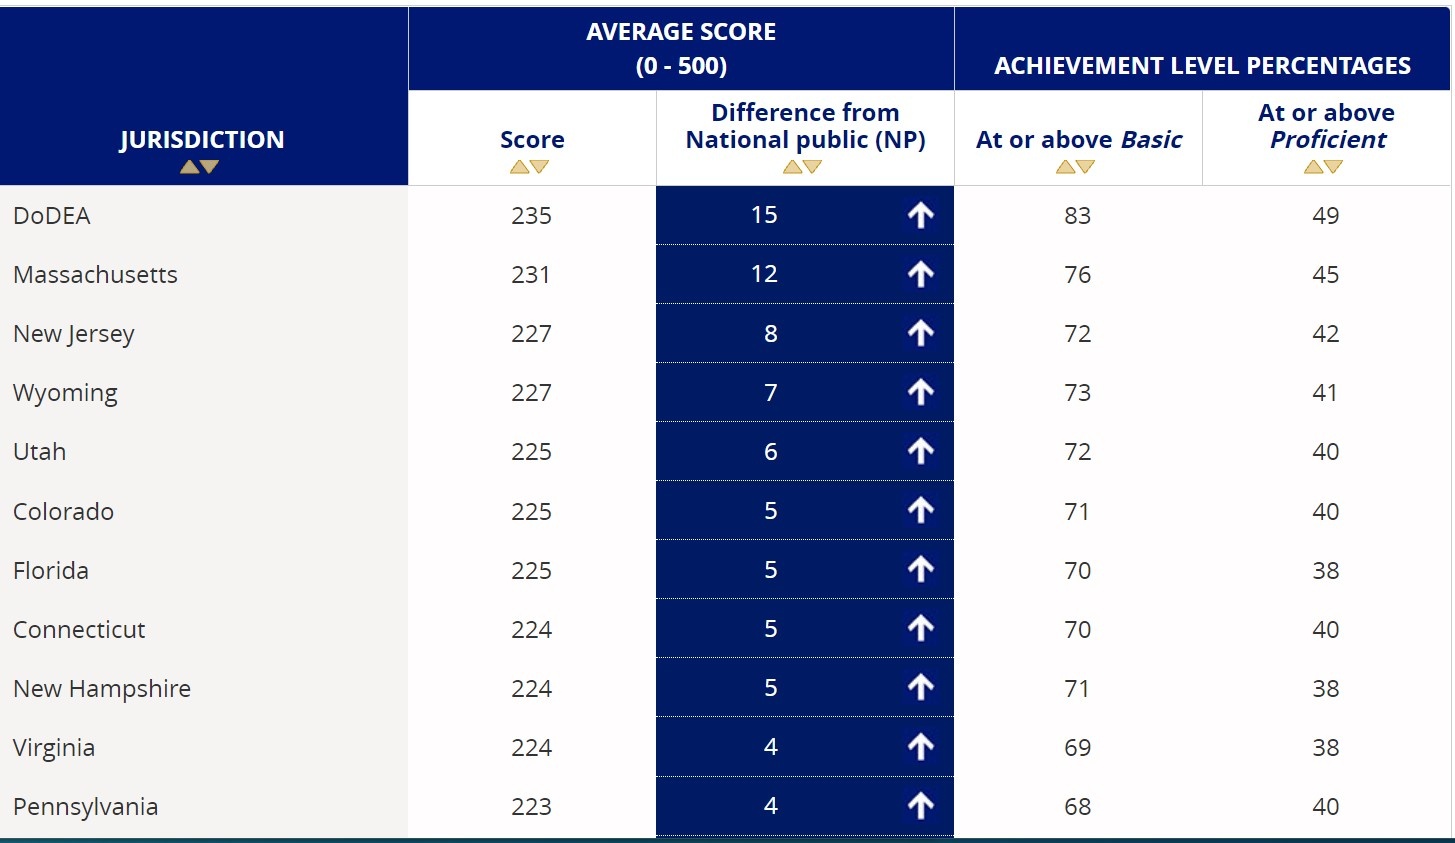
Figures 3 through 6 compare Virginia SOL test pass rates with Virginia National Assessment of Educational Progress (NAEP). NAEP tests are administered every two years nationally, and can serve as a reference point by which to evaluate our outcomes relative to the rest of the country. These charts demonstrate a declining trend on state SOL results (caused by the implementation of more rigorous state tests), which correspond with increases on NAEP results. This seems to support the notion that higher expectations (increased rigor of SOL tests) yields higher performance (relative to the NAEP assessment). The topic of expectations and results will be explored further in the next article.


Matt Hurt is director of the Comprehensive Instructional Program based in Wise.
Leave a Reply
You must be logged in to post a comment.