
by John Butcher
It’s been a while since I sent Jim a bang per buck analysis of school performance. Now that the 2016 SOL data are out, I’ll try to get back in the groove.
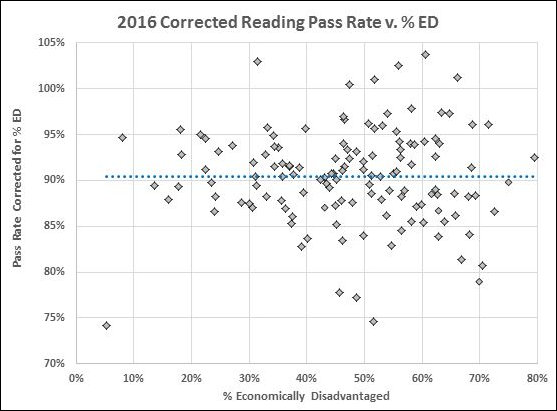
In the past I have plotted the raw division SOL pass rates vs. the annual disbursements per student. But comparing bang-for-the-buck between different school systems is a tricky business. We know, for example, that poverty impacts academic performance. As shown in the scatter graph below, economic disadvantage explains about 39% of the variation in 2016 reading test scores.

To level the playing field this year, I’ve adjusted each division’s pass rate to eliminate the effect of economic disadvantage. (I can offer an explanation in the comments, if you’d like to know the details.)
You might notice that six divisions show corrected pass rates exceed 100%. That is because their pass rates were high in the first instance and considerably higher than their average ED would predict.
That rising tide floats all boats: The adjustment also raises the City of Richmond from an actual 60% pass rate to an adjusted 79%.
As to cost, VDOE will not post the 2016 data until sometime this spring so we’ll have to make do with 2015 data for disbursements per student (using end-of-year enrollment).
On that basis, here are the 2016 division average reading pass rates, corrected for the economic disadvantage of the division’s studentbody, plotted vs. the 2015 division disbursements per student.
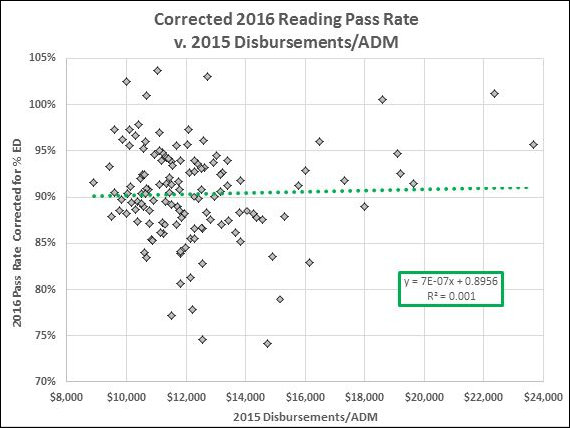
The fitted line suggests a slight increase in score with disbursement but there is no correlation. That is, spending more per student is not correlated with better pass rates.
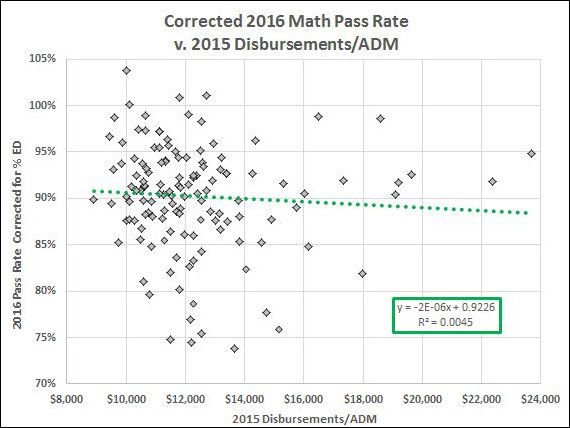
Here the slope might suggest a negative correlation between pass rate and disbursement except that the R2 again tells us that there is no correlation.
The five subject average tells the same story.
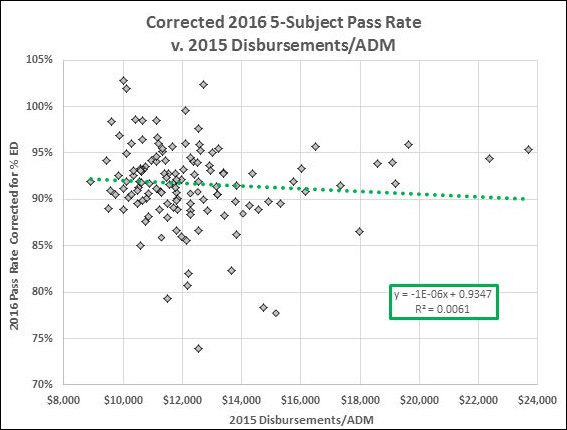
These data support the same conclusion as the earlier, unadjusted numbers: At the division level in Virginia, larger disbursements per student do not correlate with better (or worse) SOL performance.
The data are here.

