Financing Public Education–Part I, Standards of Quality

by Dick Hall-Sizemore

The 2022-2024 budget proposed by Governor Northam includes $8.6 billion in general fund appropriations in the first year and $8.3 billion in the second year for state assistance to local K-12 programs. These amounts are a little more than a quarter of the entire general fund budget. Compared to the appropriation for the current fiscal year, these proposed amounts are an increase of $1.3 billion (18.2 %) in the first year and $1.0 billion (14.3%) in the second year. It is easily the largest budget proposed for public education in the state’s history.

The details of state funding for public education can be mind-numbing; they take up more than 40 pages of closely-spaced type in the proposed budget bill. Those details are known and understood by only a relative handful of individuals in and around state and local governments.

State financial assistance for K-12 is provided in four basic categories: Standards of Quality, Incentive Programs, Categorical Programs, and Lottery Proceeds. The Standards of Quality (SOQ) category is, by far, the largest, constituting more than 80% of the total each year. This article is a high-level overview of SOQ funding and a subsequent installment will cover the other aspects of state funding.

Standards of Quality

Background

The Virginia Constitution directs the General Assembly “to seek to ensure that an educational program of high quality is established and maintained.” (Article VIII, Section 1)

It is important to note that the constitution does not attempt to define what should constitute such a system. Rather, it requires the following steps to be taken:

  1. The Board of Education shall determine and prescribe “standards of quality” for the school divisions, subject to revision by the General Assembly;
  2. The General Assembly shall determine the manner in which funds are to be provided to maintain the program prescribed by the standards of quality;
  3. The General Assembly shall provide for the apportionment of the cost of such program between the state and the local units of government; and
  4. Each local unit of government shall provide its portion of such costs.

The SOQ funding methodology was developed in the mid/late 1980s and has remained largely in place since then. The following policy decisions form the basis of the methodology:

  1. The SOQ is the minimum educational program that school divisions must provide;
  2. The state will fund its share of this minimum cost only. Anything provided by local school divisions above the minimum must be funded entirely by them;
  3. The state will fund, on the statewide level, 55% of the cost of maintaining the SOQ;
  4. The actual proportion funded by each locality will vary, based on the locality’s ability to pay (composite index);
  5. The state share for each locality will be distributed on the basis of average daily membership (ADM).

The Appropriation Act sets out various accounts, or categories, for the SOQ, each of which has a line-item appropriation. The largest category is basic aid, which includes the funding for the 51 professional staff per 1,000 pupils required by the SOQ, along with support costs. With some exceptions, the basic approach is to calculate a division’s total cost related to SOQ, using statewide prevailing costs and the division’s average daily membership. With that total cost in hand, the amount that the state will provide toward this total cost is determined by the locality’s composite-index score.

Total costs 

Some costs have an established standard. Personnel fringe benefits would be one example. Another example would be textbooks. The proposed budget bill stipulates $132.38 per pupil for textbooks.

For those items for which there is no established standard, primarily salaries, the formula uses “prevailing cost.” That amount is calculated “using the ‘linear weighted average’, a weighted average giving greatest weight to division costs closest to the median cost (up to a weight of 5), and least weight to division costs closest to the highest and lowest outlying values (down to a weight of 1).” Based on this calculation, the proposed budget bill sets out the following “statewide prevailing salary levels”:

  • Elementary teacher–$53,996
  • Elementary assistant principal–$75,435
  • Elementary principal–$93,869
  • Secondary teacher–$56,977
  • Secondary assistant principal–$81,093
  • Secondary principal–$102,844
  • Instructional aide–$21,304

Thus, the prevailing cost for an elementary school teacher is the same in Lee County as it is in Virginia Beach. As an overview of SOQ funding dryly notes, an individual school division’s “actual costs can be above or below the linear weighted average values used for SOQ funding.”

It needs to be noted that the proposed budget bill does provide that “cost of competing” adjustments of 9.38% for instructional personnel and 18% for support personnel be applied to the cost of school divisions in Planning District Eight (Northern Virginia) and the counties of Accomack and Northampton. (The Eastern Shore counties had not been included in this provision in previous Appropriation Acts.) Furthermore, it provides that the prevailing costs for school divisions bordering Planning District Eight be increased by 25% of the cost of the competing adjustment provided for Northern Virginia divisions. (The localities eligible for this lower cost-of-competing adjustment are the counties of Stafford, Fauquier, Spotsylvania, Clarke, Warren, Frederick, and Culpeper and the cities of Fredericksburg and Winchester). As a result, the funded cost for an elementary teacher in Fairfax County is $59,421 and, in Spotsylvania, $55,324.

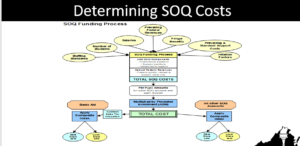
To determine a division’s cost in a SOQ category, or account, DOE calculates the instructional costs, using the staffing standards set out in the SOQ and the prevailing cost. It then calculates the costs for any factors related to that category.  The SOQ costs are funded in several categories, including basic aid,  textbooks, special education, gifted education, etc. Each category has its own formula. Basic aid is the largest and most complex category. The total cost of all those categories is the total SOQ cost.

An example of the basic aid methodology best illustrates the process. Based on its projected average daily membership, the basic aid formula determines that Spotsylvania County would have 616.01 funded elementary school teachers at a funded cost of $34.1 million in the first fiscal year of the next biennium. That sort of calculation is made for each of several categories of instructional personnel, as well as for equipment, transportation, and support personnel to arrive at a total SOQ cost for basic aid of $156.5 million. Dividing that amount by the projected ADM and adding in a couple of adjustments yields a per-pupil allowance for basic aid of $6,962. When that amount is multiplied by the projected March 31 ADM, the total cost of basic aid comes to $161.9 million.

For the basic aid category only, the total cost is adjusted by subtracting the distribution of sales tax revenue to the locality. For Spotsylvania, that would be $32.8 million, leaving a net basic aid cost of $129.1 million. That amount would then be allocated by the county’s composite index to determine the state share ($81.7 million). Similarly, the total costs calculated for each of the other SOQ categories would be allocated by using the composite index. The total of all the various SOQ accounts would be the total SOQ funding from the state for the county ($147.1 million).

Here is a picture of the SOQ funding methodology:
Composite Index

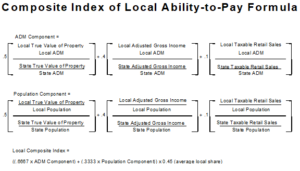
The composite index is the mechanism used to implement the constitutional directive to “apportion” the cost of SOQ programs between the state and localities. It is a measure of each locality’s financial resources relative to state average values and, as such, can be considered an indication of a locality’s ability to pay. In addition to being used to determine a locality’s matching amount for SOQ programs, it is also used to determine the state/local split on other direct aid to education programs.

Three factors are used to construct the composite index:

  • True value of real property in the locality (weighted 50%)
  • Virginia adjusted gross income in the locality (weighted 40%)
  • Taxable retail sales in the locality (weighted 10%)

Following are the steps used in constructing the composite index:

  • Each component is expressed on a per-capita basis using local population (weighted 33%) and on a per-pupil basis using ADM (weighted 67%);
  • The index value for each locality is the local per capita/per pupil values as a proportion of the corresponding statewide average values.
  • The formula is adjusted so that the statewide average local share is 45% and the statewide average state share is 55%. Each index value represents the percentage of formula costs that must be funded from local funds. Examples: the composite index of Halifax County for the upcoming biennium is .3076, which means that the county will be responsible for 30.76% of its SOQ costs and the state, 69.24%.  Conversely, Fairfax County will have a composite index of .6532, resulting in the county paying 65.32% of its SOQ costs and the state, 34.68%.
  • Any index is capped at 0.80, meaning that the most that any locality will pay toward its SOQ costs is 80%, with the state paying the remaining 20%.
Source: Virginia Dept. of Education


The composite index scores for the upcoming 2022-2024 biennium range from .1714 to .8000. Nine localities have the highest composite index of .8000. They are:

  • Arlington County
  • Bath County
  • Goochland County
  • Lancaster County
  • Rappahannock County
  • Surry County
  • Alexandria
  • Falls Church
  • Fairfax City

The five localities with the lowest composite index scores are:

  • Lee County–.1714
  • Scott County—.1893
  • Buena Vista–.1942
  • Hopewell–.2022
  • Henry County–.2179

The inclusion of several rural counties in the list of localities with the highest composite index scores may come as a surprise to some. To understand this result, one must keep in mind that the composite index is based on relative values.

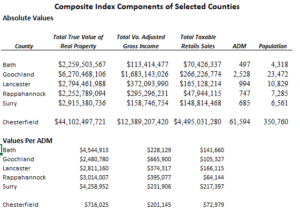
The reasons for high composite indexes vary somewhat from county to county.  The tables below illustrate how the process plays out.
Source of data: Virginia Dept. of Education

The first table lists the total true real property value, total adjusted gross income, taxable retail sales, and ADM in each of the five rural counties with a composite index of .8000. For comparison, Chesterfield County is also included. Its composite index, .3546, is the median value.

The second table shows the value of each component per ADM for each locality.  Thus, although the total value of real property in Chesterfield is almost 20 times higher than that in Bath County, the former locality has about 124 times the number of students.

The ratio of total property value per ADM is the most heavily weighted factor in the calculation of the composite index.  Close behind is the ratio of AGI per ADM. Due to a combination of high total property value as a result of being the home of significant taxable Dominion Energy facilities (Bath and Surry), extensive, expensive waterfront property (Lancaster), or large expensive rural estates (Goochland and Rappahannock); high AGI; and low, or relatively low, ADM, these rural counties are rated, along with Arlington, Alexandria, Falls Church, and Fairfax City, as having the highest ability of all Virginia localities to pay their share of SOQ costs.

As is the case for many such formulas, there is a lag in the data for the components of the composite index formula. 2019 is the base year of the indicators of ability-to-pay (property value, AGI, and retail sales) for the 2022-2024 composite index scores, and the March 31, 2020 ADM and 2020 census are the population data sources. For a listing of all the composite index scores by locality, see here.

State sales tax

The second largest component of SOQ funding, and of state funding of public education, in general, is the assigned portion of the revenue collected from the state sales tax. The proposed budget bill for the 2022-2024 biennium includes an estimate of $1.7 billion in FY 2023 and $1.6 billion in FY 2024. Unlike other sources of funding, which are distributed based on ADM, most of this revenue from the state sales tax is distributed by school-age population. The Appropriation Act treats these sales tax proceeds as part of the locality’s share of the cost of basic aid. Accordingly, after the total SOQ cost for basic aid is calculated for a locality, the projected distribution of sales tax revenues is deducted from that amount before the composite index is applied to determine the state and local shares of the cost. That action effectively reduces the amount of general fund appropriation the state must provide toward the SOQ cost.

Rebenchmarking

Every two years the Department of Education updates the SOQ funding formula and the composite index. This “rebenchmarking” is a technical exercise. It does not change the components of the formulas, just the cost and enrollment figures that are entered into the formulas.

Most of the data elements are fixed for the biennium. These include the funded salary amounts and the initial fall membership and ADM data that are used in the SOQ model. (The actual distributions are based on the annual March ADM.)

The rebenchmarking is always one of the major drivers of the increases in the biennial budget bill. For the 2022-2024 biennium, DOE estimated the cost of rebenchmarking would be $153.8 million for FY 2023 and $177.2 million for FY 2024, a $331 million increase for the biennium, which the Governor included in his introduced budget. There were 31 separate items that were updated, some increases and some decreases, to arrive at the final figure. The most significant ones were related to enrollment increases and increases in salary costs. More details on rebenchmarking can be found here by clicking on the appropriate document for the Oct. 22, 2021, meeting.

The composite index scores for each division are also updated during the rebenchmarking process. The most recent data for total true value of real property, total Virginia AGI, total taxable retail sales, ADM, and population are used. As a result of the rebenchmarking for 2022-2024, the composite index for 64 localities decreased, meaning they will be responsible for a lower percentage of their SOQ costs. Sixty-two localities will have a higher composite index; eight will remain unchanged.

The three localities that will experience the greatest increases in their composite indexes will be Greensville County, Powhatan County, and the city of Richmond. These increases can have a significant fiscal impact on a locality. For example, due primarily to significant increases in property values and AGI over the last two years, the composite index for the city of Richmond will increase by .0451. The city estimates that this increase will result in a loss of about $10 million annually in state revenue. That loss would be in addition to a $20 million reduction anticipated in SOQ funding due to a decline in student enrollment.

The new composite index for each locality, as well as a tab that shows the change for each locality, can be found here.

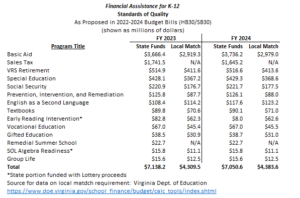
The table below lists all the SOQ “accounts” and their appropriations for each year of the upcoming biennium. (Note the table was updated on 1/12/2012.)
 

Next installment: Non-SOQ financing for public education

The main sources for this article were:

  1. Overview of Virginia’s K-12 Funding Formula.  Powerpoint presentation by Kent Dickey, Deputy Superintendent of Budget, Finance, and Operations. Found  here.
  2. Various tables showing the distribution of aid by division, here.
  3. Item 137 of the 2022-2024 budget bill.
  4. Responses by VDOE staff to emails from me, asking questions and seeking clarifications.

Share this article


ADVERTISEMENT

(comments below)


ADVERTISEMENT

(comments below)


Comments

54 responses to “Financing Public Education–Part I, Standards of Quality”

  1. LarrytheG Avatar
    LarrytheG

    I have not read this in detail but I am looking forward to it. This is comprehensive, fact based, and not a hint of partisanship or culture war.

    Thank you, once more for ‘delivering” an excellent informed commentary.

  2. Kathleen Smith Avatar
    Kathleen Smith

    Looking forward to the read. The central office budget is also interesting. Employees come in one day per week of their choice but the tax payer is putting up almost a million for rental, furniture, etc. For real?

    1. Eric the half a troll Avatar
      Eric the half a troll

      The concern you voiced is true for nearly every professional business (post-Covid) in the US. The problem is that the properties/offices are either owned outright or are tied up in long term leases. This is a Covid shoe that has yet to drop. As commercial real estate (CRE) leases come up, companies will be downsizing offices and will not be renewing. There is a crash in CRE coming and that often leads to a full-scale recession (that can be very deep and long). I have heard of some preemptive conversions of CRE to residential in an attempt to defray the coming damages but watch out. Impact to government finances is the least of our worries in this area.

      1. For once, I agree with you. COVID has created a long-term shift in demand for commercial real estate, a mainstay of local real estate taxes. Meanwhile, the trend to online shopping is hollowing out localities’ retail base. Local governments will have to find new sources of revenue (or, god forbid, actually find way to cut spending).

      2. Nancy Naive Avatar
        Nancy Naive

        We just cut our floor space by 40% and down negotiated the sqft $s. More than 60% working from home. It’s the 1st time in 40 years every employee doesn’t have a private office.

        Not 40 years. 59 years.

      3. DJRippert Avatar
        DJRippert

        You are right about the second shoe of a commercial real estate crash coming. Places like Tysons could be very much screwed unless that “city” quickly makes the changes necessary to make it a great place to live regardless of whether one works there.

        1. LarrytheG Avatar
          LarrytheG

          I think it may well be a fundamental change – a paradigm shift.

          And the 2nd degree changes could be significant – like what rush hours on urban beltways look like.

          Or how employee performance is accurately ascertained.

        2. Eric the half a troll Avatar
          Eric the half a troll

          The DC area may dodge the bullet a bit. Defense contractors often are doing classified work which can not be done via WAFO. These employees have been working in person at the office throughout Covid. They will have to retain their office spaces. Clearly, we won’t avoid the crash completely in NoVA but it might not be as bad as elsewhere.

          1. LarrytheG Avatar
            LarrytheG

            DC is not only the HQ of DOD, but HQ of most all the govt from Interior to Agriculture to all the other agencies also and more than a few of them live 50 miles out in the outer suburbs and have been allowed to work from home.

            A hell of a lot of energy and road capacity is spent on beltway and outer suburb commuting… once bosses figure out how to measure performance of remote workers, we’re off to the races… IMHO of course.

  3. Matt Hurt Avatar
    Matt Hurt

    Excellent article! Very well explained.

    I know this wasn’t addressed in the article, but it is keeping me up at night. I understand the Governor’s proposed budget includes a 10% increase for teacher salaries over the biennium, 5% per year. While that sounds like a lot, increased inflation rate has the potential to make it a decrease in salaries in terms of real spending power. Most sources quote an inflation rate just north of 6% over the last year. If that persists over the biennium, teachers’ salaries in two years will be able to purchase 92% of what they were able to purchase last year- if they get the 10% raise!

    This is a problem because teaching candidates are few and far between, and there’s a significant number of positions currently unfilled. As teaching salaries become less competitive, this problem will increase. Certainly, many teachers don’t go into the field primarily for money, but as the money recedes, many will find other vocations.

    Another problem that exacerbates this is the fact that compared to other states, Virginia teacher salaries are not as competitive, relatively speaking. For example, Virginia ranks 8th in the nation for average household income, but 32nd in average teacher salary. It seems to me that we need to work to close the gap between those rankings, and if we do, it should help to solve the teacher shortage problem.

    1. Dick Hall-Sizemore Avatar
      Dick Hall-Sizemore

      You make good points. Of course, state employees generally would be in the same boat as teachers if inflation keeps up at this pace. However, central bankers project that inflation will be down to about 2.6 percent by the end of 2022 and lower in the year after that. https://www.washingtonpost.com/business/2021/12/29/inflation-2022-price-fed/

      1. James C. Sherlock Avatar
        James C. Sherlock

        “Central bankers” did not see current inflation coming.

        1. Dick Hall-Sizemore Avatar
          Dick Hall-Sizemore

          That is true. Hopefully, they have learned.

        2. Nancy Naive Avatar
          Nancy Naive

          Unless, they just kept mum. But, they are saying 2022 will be 2.6 or so.

      2. Matt Hurt Avatar
        Matt Hurt

        Yes sir, you’re right about all those state jobs.

        I hope you’re right about the inflation, but all I see is the money supply shooting for the moon, and goods and services are still in short supply. I’m not going to hold my breath for inflation to become reasonable. I think the central bankers tell folks things will get better soon to keep the pitchforks and torches at bay. They’re certainly part of the inflation problem.

    2. James Wyatt Whitehead Avatar
      James Wyatt Whitehead

      Mr. Hurt I have my Aunt Liz’s 1924 teaching contract from Highland County. 50 dollars. A month. Step Zero in Highland today is a hair under 39,000 dollars. I wonder what teachers will make in another 98 years?

      Duty number 1 on the contract: light the coal stove every morning. It was an old fashioned one room school house.

      1. Matt Hurt Avatar
        Matt Hurt

        If inflation keeps up, it’ll be in the billions. The lowest denomination will be the measly million dollar copper coin.

    3. James C. Sherlock Avatar
      James C. Sherlock

      Pay is one of the issues. See Government Attacks on Parental Choice in Virtual K-12 Public Education in Virginia – Chapter 1. Teacher shortages posted this morning for some of the others.

      1. LarrytheG Avatar
        LarrytheG

        I for one, would like to see Matt go read Capn Sherlocks recent blog posts and offer his comments. Also would like to hear from Mr. Whitehead if he is so inclined.

  4. James Wyatt Whitehead Avatar
    James Wyatt Whitehead

    Top shelf Mr. Dick! And this is just the money side of the SOQs. That is a big bee hive when you look at all of the other parts.

    1. Dick Hall-Sizemore Avatar
      Dick Hall-Sizemore

      I am working on those other parts.

  5. DJRippert Avatar
    DJRippert

    “It needs to be noted that the proposed budget bill does provide that “cost of competing” adjustments of 9.38 percent for instructional personnel and 18 percent for support personnel be applied to the cost of school divisions in Planning District Eight (Northern Virginia) and the counties of Accomack and Northampton.”

    I understand the inflator for high-cost NoVa but why is the same inflator also used for low-cost Northampton and Accomack Counties? A bit of a Byrd Machine “thank you” for Northam’s home area?

    I also find it interesting that teachers’ salaries are inflated 9.38% while support personnel salaries are inflated 18%. Are campaign donations from the teachers’ association more driven by administrative personnel?

    It certainly seems reasonable to consider cost-of-living when looking at salaries. However, the same approach seems to be lacking in the calculation of the composite index. To wit:

    True value of real property in the locality (weighted 50 percent)
    Virginia adjusted gross income in the locality (weighted 40 percent)
    Taxable retail sales in the locality (weighted 10 percent)

    The actual cost-of-living index and related poverty rate has been calculated by the Weldon Cooper Center for various areas in Virginia. The “Beltway” area, which includes all of Arlington County, jumps from a poverty index of 7.4% to 12.3% when relative cost of living is considered. This puts Arlington as the 7th of 11 areas in terms of cost-of-living adjusted poverty rate.

    Kind of hard to see why Arlington is at a full .8000 on the composite index.

    Or maybe it’s easy to understand as Arlington is poorly represented by the Democrats who that county elects to represent it in Richmond.

    https://demographics.coopercenter.org/sites/demographics/files/VirginiaPovertyMeasure_FindingsOverview_May2013_0.pdf

    1. Dick Hall-Sizemore Avatar
      Dick Hall-Sizemore

      The increase in property value is captured, although there is a two-year data lag. But, to your main point: The cost of living is only indirectly reflected in AGI and taxable sales.

      Who Arlington is represented by does not affect the composite index. The composite index was developed about forty years ago.

      Finally, the different rates “cost of competing” result from methodologies developed several years ago and agreed upon by JLARC and the legislature. The inclusion of the Eastern Short is new this year and I have not seen any explanation or justification for doing so.

      1. DJRippert Avatar
        DJRippert

        “The composite index was developed about forty years ago.”

        So what?

        Lots of bad laws have been on the books for decades in Virginia. You have written extensively about the new political division apportionment approach following the most recent census. How long was the old, gerrymander centric approach on the books?

        Arlington, overall, is a middle wealth county (in the state) when viewed through the reasonable lens of cost-of-living adjusted wealth. Yet the state politicians elected from Arlington have no issue with mid-wealth Arlington transferring the top rate of funds via the composite index.

        Based on cost-of-living adjusted poverty rates, the Hampton Roads area is more wealthy than Arlington. Yet none of those jurisdictions are among the 0.8000 “award winners”.

        Basing measures of locality wealth without any cost-of-living context is asinine. The state seems to understand that for teachers’ and administrative salaries but not for the composite index. Meanwhile, the politicians elected from Northern Virginia remain fat, dumb and happy with the results.

        Shame on them.

        As for the Eastern Shore … I smell a rat and the rat’s name is Ralph.

        1. LarrytheG Avatar
          LarrytheG

          ‘It needs to be noted that the proposed budget bill does provide that “cost of competing” adjustments of 9.38% for instructional personnel and 18% for support personnel be applied to the cost of school divisions in Planning District Eight (Northern Virginia) and the counties of Accomack and Northampton.”

          District 8

          Loudoun, Prince William, Fairfax, Arlington, Alexandria, Manassas, Manassas Park

          Isn’t Arlington receiving a cost-of-living adjustment?

          Are you complaining about the rate of adjustment for the richer counties or are you complaining about the concept of the Composite Index which seeks to allocate a certain level of resources to each school regardless of the local finances.

          would you not have that system and just have each locality fund schools as they see fit?

          1. DJRippert Avatar

            The composite index should be based on cost-of-living adjusted metrics.

  6. LarrytheG Avatar
    LarrytheG

    Excellent and INFORMATIVE! I don’t know about other counties BOS -School Board budget process but since you used Spotsylvania in some examples, I can say that;

    1. – The budget folks for the School Systems knows this data backwards and forwards and enjoys presenting it to the BOS, who often and usually do not have the patience to really understand it.

    2. – More often than not, they complain about the size of the budget, and why it always goes up and not down and where are some savings.

    3. – Of late, they also grump mightily about ‘carry-over” money which is money that was in a line-item in the budget doc but not spent or less than budgeted, spent, and the SB wants to keep it and reallocate it to other uses and the BOS wants it back and so there are ‘words” and multiple encounters to eventually reach an agreement.

    4. – Any employees that are not SOQ-positions, the county gets no help from the state, they have to fund that position 100% including retirement, health insurance and “state’ raises!

    5. – The SB was recently scammed out of several hundred thousand dollars leaving a lot of egg on faces:

    ‘We were spoofed’: Spotsylvania County Public Schools loses $600K to email scam

    https://www.wric.com/news/local-news/we-were-spoofed-spotsylvania-county-public-schools-loses-600k-to-email-scam/#:~:text=(WRIC)%20%E2%80%94%20Spotsylvania%20County%20Public,on%20a%20new%20football%20field.

  7. James C. Sherlock Avatar
    James C. Sherlock

    Excellent work.

  8. James C. Sherlock Avatar
    James C. Sherlock

    Dick is working here to explain state funding.

    For reference, Fairfax County spent $2,880,459,612 on its public schools in FY 2019. That comes to $15,360 per kid. Over 78% of it was local tax funds.

    Lee County spent a total of just over $36 million on education in that same year. That came to just over $11 thousand per pupil. Of that, 13% was local money.

    Statewide, schools averaged $12,427 per pupil. Of that, 51.3% was local funding.

    1. Nancy Naive Avatar
      Nancy Naive

      “Your mileage may vary…”

    2. LarrytheG Avatar
      LarrytheG

      Once the state equalizes basic funding, nothing precludes a district from adding “more” for their kids if taxpayers support it. School districts do it also on a per-school basis if there is sufficient demand for courses beyond basic courses.

      People, especially higher-income Asians and in geneal, in NoVa will specifically locate where they live relative to the quality of the school.

      Overall, a lot of people will move into a neighborhood that is more affluent, believing the neighborhood school caters to those who want ‘more” and “better”.

      The poor cannot do that, they’re stuck with whatever neighborhood they can afford to live in and the neighborhood school will reflect the demographics of the neighborhood.

      1. James C. Sherlock Avatar
        James C. Sherlock

        “If their taxpayers support it.” Virginia is a very diverse state in terms of taxable wealth. There are some school divisions whose taxpayers are tapped out regardless of what they support.

        1. LarrytheG Avatar
          LarrytheG

          Well yes, and if the tax rate is too high, voters let them know at elections.

          But many places where incomes are high, usually want and are willing to pay for a lot more “school’.

          Of course, not all of those in the minority agree.

          People actually DO move to districts with more comprehensive school programs.

          And people who are in the minority and overtaxed will move to lower-tax places with lesser schools.

  9. Stephen Haner Avatar
    Stephen Haner

    Of all the promises made in the campaign, Youngkin’s pledge to pass the largest education budget ever was the easiest to keep. For me it rated a duh. That statement has been true for most of the budgets over the past decades, with only the occasional recession interrupting the trend. The Assembly could trim the introduced bill a bit, and it would still be the largest in nominal dollars.

    1. Dick Hall-Sizemore Avatar
      Dick Hall-Sizemore

      I always felt the same way. The problem is, of course, the general public was not aware of this and the media, nor his opponent, never challenged him. As a consequence, he was able to get away with sounding like he was so much more supportive of public education.

      1. Stephen Haner Avatar
        Stephen Haner

        So why does that mean he is not supportive? You are jumping to a partisan conclusion…

        1. Dick Hall-Sizemore Avatar
          Dick Hall-Sizemore

          I did not mean to imply that he is not supportive. That was poorly put, on my part. I meant that he was able to take the position that he would be doing more, relatively speaking, than other governors had done.

    2. LarrytheG Avatar
      LarrytheG

      re: ” Of all the promises made in the campaign, Youngkin’s pledge to pass the largest education budget ever was the easiest to keep. ”

      Which if you think about it, is exactly the complaint JAB makes when say “MO MONEY” , no?

      One thing to offer MO MONEY , quite another to specify what MO MONEY is going to be spent on to improve education beyond just throwing more money at it.

      No?

      and no, that’s not a partisan comment unless you think “Mo Money” is a partisan comment….. usually directly at Dems… 😉

  10. Nancy Naive Avatar
    Nancy Naive

    Standards of Quality is a bit of a misnomer. It’s more like the base model Taurus station wagon.

    1. Dick Hall-Sizemore Avatar
      Dick Hall-Sizemore

      It’s all relative. The Taurus was better than the Pinto.

      1. Nancy Naive Avatar
        Nancy Naive

        Well, ya got me there. At least the Taurus didn’t explode backing into a parking spot.

        Somehow, I’m willing to bet the SOQ calculation is similar to the AMT calculation. Designed to fill a gap between the wealthy and the poor by screwing the middle class. Plus, not properly adjusted for inflation, it thus screws more and more middle class every year.

  11. Nancy Naive Avatar
    Nancy Naive

    Standards of Quality is a bit of a misnomer. It’s more like the base model Taurus station wagon.

  12. vicnicholls Avatar
    vicnicholls

    Thanks Dick. Lots to chew on here.

  13. Fred Costello Avatar
    Fred Costello

    Comparing wages is not sufficient. Benefits must be included in the comparison, so total compensation is compared. In industry where I worked, average salary increases did not keep up with inflation. So why should average teacher salaries? Good employees were retained by above-average salary increases.

  14. LarrytheG Avatar
    LarrytheG

    re: ” The Virginia Constitution directs the General Assembly “to seek to ensure that an educational program of high quality is established and maintained.” (Article VIII, Section 1)

    It is important to note that the constitution does not attempt to define what should constitute such a system. Rather, it requires the following steps to be taken:
    .
    .
    .
    The actual proportion funded by each locality will vary, based on the locality’s ability to pay (composite index);”

    I was under the impression that somewhere in the Constitution, it specified that kids across the state would receive ‘equivalent” education resources no matter the region or the finances of their county.

    All the other stuff is basically a “formula” for HOW Virginia distributes funds to localities for education.

    Only when they get to the composite index, do they decide/calculate how to assure that kids in poor counties (in theory) received equivalent resources.

    I think there might have been a SCOTUS ruling on this also and other states do something simliar but not the same as Virginia… almost unique to each state… I thought that some states, in fact, 100% fund local education from state monies…

    Comparing states on school funding would be interesting, but a hell of a lot of work for whoever tried to put that essay together.

    https://www.ecs.org/50-state-comparison-k-12-and-special-education-funding/

    1. Dick Hall-Sizemore Avatar
      Dick Hall-Sizemore

      Many have asserted that, under the principles of equal protection, kids should receive the same level of education, regardless of the wealth of the area in which they live. Some state supreme courts have declared that heavy reliance on property taxes to finance schools violated those states’ constitutional equal protection guarantees. The most well-known of these cases are the series of Serrano cases in California. However, the U.S. Supreme Court, in a case coming out of Texas, ruled that such a system does not violate the 14h Amendment because it does not intentionally or substantially discriminate against a class of people. https://edeq.stanford.edu/sections/landmark-us-cases-related-equality-opportunity-education

      While not guaranteeing every child an “equivalent” education, the Virginia Constitution a minimum level of education that strives to be “high quality”. The constitution requires the Board of Education to establish these minimum “standards of quality” that each locality must meet, through a combination of state and local funding.

      Areas of the state that have more wealth will put more money into their schools. (It should be noted that the kids of poor people who also live in those areas benefit from this additional school funding as well as the kids of rich folks.) As Matt Hurt has demonstrated on this blog, however, many kids in some of the poorer areas of the state also do quite well under this system, based on the SOL test scores. So, while money matters, it is not the sole determining factor in the quality of education kids receive.

      1. LarrytheG Avatar
        LarrytheG

        So, it’s the SOQ , other? stipulation of specific minimum numbers of staff to provide education services to every system that is “guaranteed”?

        And the composite index determines how much of the cost the state will bear based on the locality “ability to pay”.

        Matt’s region VII has, IMHO, demonstrated that some level of basic reading, writing, math can be achieved by implementing best-practice standards on how it is taught, i.e. modelling the techniques of the teachers who are successful with their practices.

        To me, it’s a common sense measure that ought to be standard for all schools in the Commonwealth but I’m not sure if Region VII kids excel beyond basic proficiency per NAEP Advanced standards. IOW, they’re doing the basics – RIGHT and more “right” than some of our schools that are serving low-income neighborhoods and kids.

        I’ve pointed out before, the irony of some school districts in Va that have some of the highest performing schools in Virginia while also have, in the same district, some of the worst schools in Virginia. Henrico is one of those districts. The schools in the more affluent parts of the county are excellent, while the ones nearer Richmond are not so – even though – to bring this back to the topic – all the schools in Henrico are staffed according to the SOQs – i.e. they all have the required minimum staffing levels (and probably more but not sure ALL have more ).

        1. Dick Hall-Sizemore Avatar
          Dick Hall-Sizemore

          What is your basis for saying some of the Henrico schools are not as good as the ones in the more affluent areas? SOL scores? Are they entirely the fault of the schools?

          Ancedote (dated, perhaps); About 35 years ago, my wife and I decided to move out of the West End, where the “better” schools were located. We ended up buying a house in the Henrico High School district, mainly because we were impressed with the principal. The school population was Black majority and drew from some of the housing projects in Henrico. A teacher in the system had told me that the school had the most diverse population of any in the county system. My daughter had some excellent teachers, with challenging classes.

          1. LarrytheG Avatar
            LarrytheG

            The basis is to compare all the schools SOL scores in Henrico on build-a-table. I can provide that if you want to see it but its true.

            I’m not “blaming” the schools. I’m pointing out that there are wide differences in SOL school performance in Henrico even though all the schools are managed and administered by the Henrico School District.

            Henrico is not alone at all in that. You can see it in quite a few school districts, including Fairfax.

            Want me to do the build-a-table for Henrico? You’ll never see JAB or Cranky do a blog post about it. They seem to prefer Richmond instead.

          2. Dick Hall-Sizemore Avatar
            Dick Hall-Sizemore

            Here is what you said:
            “The schools in the more affluent parts of the county are excellent, while the ones nearer Richmond are not so.” You acknowledged that you used SOL scores as the basis for that statement. The demographics of the county vary greatly. Those in the west end are in the affluent end. Those in the East End and near the Richmond boundary line are in minority, poorer areas. For many reasons, as we all have discussed, kids from these areas don’t do as well on SOL tests. To make a valid comparison among the schools, you would need to compare the SOL tests of the ED and nonED populations in each school.

          3. LarrytheG Avatar
            LarrytheG

            So, you’re presuming that the issue has more to do with the demographics than the school or teachers or public education in genera – or allocation of SOQ staff?

            I went ahead and pulled the elementary reading scores from build-a-table:

            School Name Pass Rate

            Glen Lea Elementary 41.97
            Laburnum Elementary 45.53
            Highland Springs Elementary 46
            Charles M. Johnson Elementary 52.07
            Cashell Donahoe Elementary 53.31
            Fair Oaks Elementary 53.93
            Elizabeth Holladay Elementary 54.83
            Harold Macon Ratcliffe Elementary 57.14
            Arthur Ashe Jr. Elementary 60
            Chamberlayne Elementary 62.37
            Dumbarton Elementary 62.37
            Montrose Elementary 62.71
            Lakeside Elementary 63.46
            Varina Elementary 64.13
            Jacob L. Adams Elementary 65.57
            Ridge Elementary 66.54
            George F. Baker Elementary 66.85
            Harvie Elementary 68.54
            Henry D. Ward Elementary 69.2
            Skipwith Elementary 70.72
            Pinchbeck Elementary 74.41
            R.C. Longan Elementary 76.04
            Seven Pines Elementary 76.26
            Ruby F. Carver Elementary 77.45
            Crestview Elementary 77.78
            Sandston Elementary 79.76
            Maude Trevvett Elementary 80.9
            Greenwood Elementary 81.18
            Pemberton Elementary 81.75
            Maybeury Elementary 81.93
            Jackson Davis Elementary 83.47
            Echo Lake Elementary 86.99
            Three Chopt Elementary 87.21
            Glen Allen Elementary 87.57
            Springfield Park Elementary 88
            Colonial Trail Elementary 89.88
            Short Pump Elementary 91.7
            Twin Hickory Elementary 91.86
            Gayton Elementary 92.41
            Tuckahoe Elementary 92.57
            David A. Kaechele Elementary 92.76
            Nuckols Farm Elementary 93.81
            Rivers Edge Elementary 93.92
            Shady Grove Elementary 94.44

            Same school District – Henrico where may presume some level of standards for teaching reading – yet a 50 point difference in results.

            Is this a public school “failure” that we hear JAB and J. Sherlock allude to in their blog posts, more often about Richmond and other?

            Sherlock had a post about how badly Loudoun did with their ED kids…

            similar issue to Herico?

          4. Dick Hall-Sizemore Avatar
            Dick Hall-Sizemore

            This data is somewhat disturbing. I am surprised that there is that large a gap. But, your question cannot be adequately answered with this set of data. We would have to drill deeper. For example, we would need to know how many ED students were included in the population of the schools at the upper end of the range, e.g. Shady Grove, Rivers Edge, Nuckols Farm, etc. Then compare the pass rates of those kids to both the ED kids in the lower range, Glen Lea, Laburnum, etc and to the non-ED kids in their own schools.

          5. LarrytheG Avatar
            LarrytheG

            I’m glad you found it disturbing. I did also. With all the discussions in BR about public schools and ‘failures’, we’ve never spent much time with districts like Henrico trying to understand the”why” even as we spend time with Richmond and talking about the “why”.

            I apologize for getting off track from the original subject -SOQ finance, tec…

  15. Ruckweiler Avatar
    Ruckweiler

    Close ALL the public schools, fire ALL the teachers and administrators, and give parents an education-only voucher to find the best private or parochial school. The public school system is irremediable.

Leave a Reply