
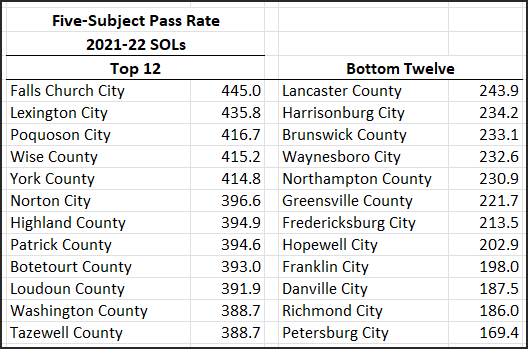
For simplicity’s sake in recent posts about the 2021-22 Standards of Learning (SOL) results, I’ve used the pass rates for English reading tests as a proxy for all five subjects, including English writing, math, science, and history. Perhaps a better way to rate the performance of Virginia school districts would be to compute a composite score of all five. Bacon’s Rebellion correspondent Jim Weigand has done so, and I publish the results here.
The table above shows the 12 school districts with the top composite scores — highest possible pass rate of 500 — and the 12 districts with the lowest composite scores. Click on the “Continue reading” link to see the scores for all school districts.
| Five-Subject Pass Rate | |||
| 2021-22 SOLs | |||
| Top 12 | |||
| Falls Church City | 445.0 | ||
| Lexington City | 435.8 | ||
| Poquoson City | 416.7 | ||
| Wise County | 415.2 | ||
| York County | 414.8 | ||
| Norton City | 396.6 | ||
| Highland County | 394.9 | ||
| Patrick County | 394.6 | ||
| Botetourt County | 393.0 | ||
| Loudoun County | 391.9 | ||
| Washington County | 388.7 | ||
| Tazewell County | 388.7 | ||
| Roanoke County | 387.0 | ||
| Wythe County | 386.0 | ||
| Virginia Beach City | 380.4 | ||
| Fairfax County | 380.3 | ||
| Arlington County | 378.9 | ||
| West Point | 377.3 | ||
| Hanover County | 376.0 | ||
| Pittsylvania County | 370.4 | ||
| Chesapeake City | 368.3 | ||
| Isle of Wight County | 366.6 | ||
| Bland County | 363.7 | ||
| New Kent County | 362.1 | ||
| Augusta County | 357.8 | ||
| Gloucester County | 357.6 | ||
| Williamsburg-James City County | 357.6 | ||
| Grayson County | 357.5 | ||
| Russell County | 356.8 | ||
| Louisa County | 356.5 | ||
| Salem City | 356.1 | ||
| Scott County | 356.0 | ||
| Goochland County | 354.0 | ||
| Montgomery County | 352.5 | ||
| Prince George County | 352.2 | ||
| Clarke County | 350.9 | ||
| Carroll County | 349.4 | ||
| Charlotte County | 346.9 | ||
| Prince William County | 346.3 | ||
| Staunton City | 344.2 | ||
| Rappahannock County | 342.5 | ||
| Dickenson County | 341.9 | ||
| Powhatan County | 339.9 | ||
| Appomattox County | 339.8 | ||
| Fauquier County | 339.5 | ||
| Franklin County | 339.0 | ||
| Bath County | 338.2 | ||
| Bedford County | 337.5 | ||
| Albemarle County | 337.0 | ||
| Surry County | 336.1 | ||
| Fluvanna County | 336.0 | ||
| Rockbridge County | 335.9 | ||
| Mecklenburg County | 334.7 | ||
| King William County | 334.3 | ||
| Floyd County | 333.8 | ||
| Mathews County | 333.0 | ||
| Nelson County | 332.7 | ||
| Giles County | 330.1 | ||
| King George County | 329.1 | ||
| Hampton City | 328.2 | ||
| Sussex County | 327.7 | ||
| Middlesex County | 326.8 | ||
| Radford City | 323.4 | ||
| Chesterfield County | 323.4 | ||
| Frederick County | 322.5 | ||
| Spotsylvania County | 322.3 | ||
| Southampton County | 322.3 | ||
| Henrico County | 321.9 | ||
| Colonial Heights City | 321.6 | ||
| Smyth County | 320.1 | ||
| Campbell County | 318.3 | ||
| Buena Vista City | 317.7 | ||
| Stafford County | 317.6 | ||
| Craig County | 317.2 | ||
| Westmoreland County | 316.3 | ||
| Orange County | 315.2 | ||
| Culpeper County | 314.5 | ||
| Lee County | 313.4 | ||
| Bristol City | 311.5 | ||
| Suffolk City | 309.6 | ||
| Northumberland County | 307.8 | ||
| Dinwiddie County | 306.7 | ||
| Alleghany County | 306.5 | ||
| Accomack County | 306.5 | ||
| Galax City | 305.6 | ||
| Winchester City | 305.3 | ||
| Rockingham County | 301.3 | ||
| Buchanan County | 300.7 | ||
| Pulaski County | 299.2 | ||
| Richmond County | 298.4 | ||
| Lunenburg County | 297.3 | ||
| Henry County | 296.8 | ||
| Amelia County | 291.7 | ||
| Halifax County | 291.3 | ||
| Warren County | 290.7 | ||
| Shenandoah County | 290.2 | ||
| Page County | 289.2 | ||
| Colonial Beach | 287.3 | ||
| Amherst County | 287.0 | ||
| King and Queen County | 287.0 | ||
| Covington City | 281.3 | ||
| Manassas Park City | 281.1 | ||
| Cumberland County | 279.5 | ||
| Caroline County | 277.7 | ||
| Manassas City | 275.1 | ||
| Lynchburg City | 274.8 | ||
| Alexandria City | 274.6 | ||
| Greene County | 270.3 | ||
| Charlottesville City | 269.5 | ||
| Madison County | 268.7 | ||
| Buckingham County | 266.3 | ||
| Nottoway County | 263.6 | ||
| Martinsville City | 259.9 | ||
| Essex County | 258.5 | ||
| Portsmouth City | 255.2 | ||
| Charles City County | 252.9 | ||
| Newport News City | 251.6 | ||
| Norfolk City | 251.4 | ||
| Prince Edward County | 248.2 | ||
| Roanoke City | 243.9 | ||
| Bottom Twelve | |||
| Lancaster County | 243.9 | ||
| Harrisonburg City | 234.2 | ||
| Brunswick County | 233.1 | ||
| Waynesboro City | 232.6 | ||
| Northampton County | 230.9 | ||
| Greensville County | 221.7 | ||
| Fredericksburg City | 213.5 | ||
| Hopewell City | 202.9 | ||
| Franklin City | 198.0 | ||
| Danville City | 187.5 | ||
| Richmond City | 186.0 | ||
| Petersburg City | 169.4 | ||
Leave a Reply
You must be logged in to post a comment.