
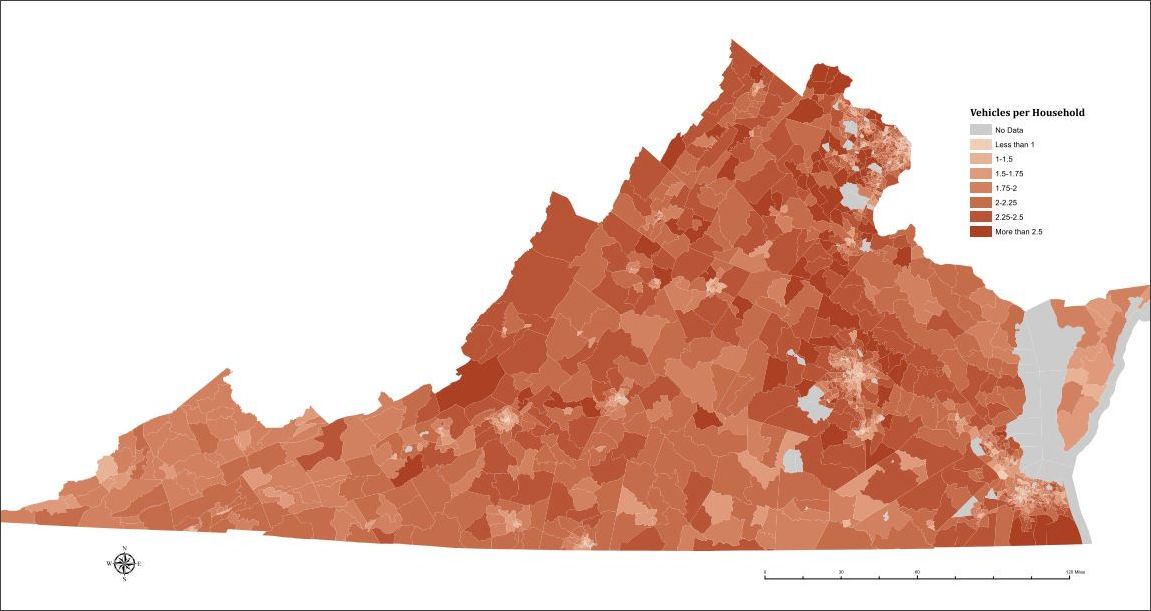
Vehicles per household. (Click for more legible image.)
Last week I published maps produced by the Vizual Statistix blog showing the breakdown of car ownership per household across the United States. Virginia appeared as the only East Coast hot spot on the map, with exceptionally high rates of automobile ownership compared to other states. Only limited conclusions could be drawn, I lamented, because the granularity of the data was so rough.
Well, thanks to Luke Juday, a Master’s student in urban planning at the University of Virginia architecture school, we can take a closer look. Juday, who goes by New Virginian on this blog, broke down car ownership by census tract, as shown above.
The super-high car ownership of more than two cars per household is mainly a phenomenon of auto-centric exurban counties ringing the state’s urban cores. There is a significant overlap of household car ownership with related metrics such as:
Cars per person
Cars per worker
Drive alone to work
Household income
Drives alone to work
Vehicle miles traveled
Juday also graphs the data and, not surprisingly, shows strong correlations between the number of adults and the number of cars in the household, as well as between the number of cars and household income.
Looking at density, Juday shows a correlation between density and car ownership (low density means more cars), and miles driven to work and density (low density means more miles driven).
The question I originally asked was, why does Virginia appear to be such an anomaly in the East Coast? Juday’s data gets us closer to an answer — the Old Dominion appears to have a combination of extensive sprawl and higher incomes. Sprawl means more car dependency, and higher incomes afford households the ability to buy and maintain more cars.
— JAB

