
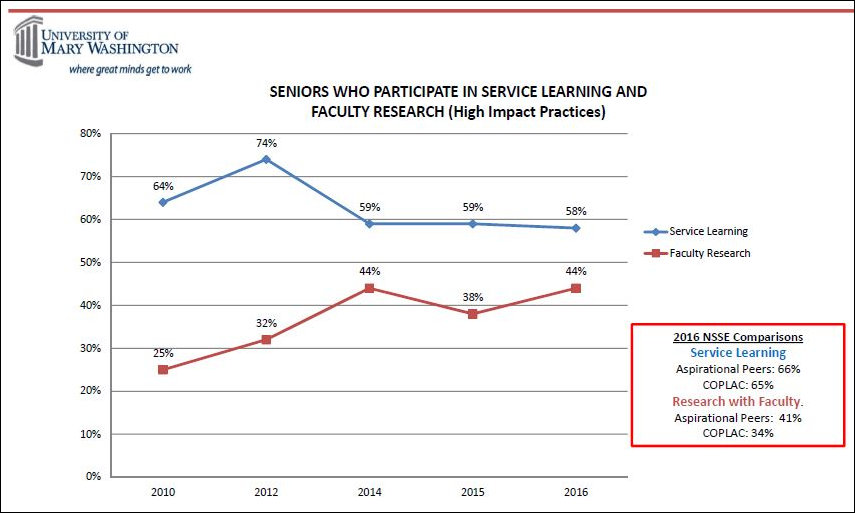
Among the data sets tracked by University of Mary Washington President Troy Paino are metrics for college seniors who participate in high-impact experiences such as service learning and faculty research. Source: University of Mary Washington
One of my goals in covering Virginia’s higher education system is to understand how colleges and universities operate as business enterprises. What are the key variables that drive revenue, costs, the quality of the educational product, and the ability of institutions to carry out their missions? As the old business saying goes, “You manage what you measure.” If we as Virginia citizens and taxpayers want to understand how college/university presidents manage their enterprises, we need to know what they measure.
When I interviewed University of Mary Washington President Troy Traino two weeks ago for the profile I published yesterday, we chatted about the metrics of his business. Traino described himself a data-driven administrator. When he first came on board last year, he could not easily lay hands on all the numbers he thought was important, he says. But he’s got a handle on the situation now, and he maintains a dashboard of institutional effectiveness that measures UMW’s progress towards its goals.
The November 2017 dashboard, which he distributed to the UMW Board of Visitors, contains 33 charts encompassing topics such as:
- Fall headcount
- Admissions data (applications, acceptances, enrollments)
- Average SAT scores and high school GPAs
- In-state vs. out-of-state enrollments, on-campus vs. off-campus residency
- Demographics such as gender, ethnicity, geography, Pell grants, 1st-generation status
- Graduation rates, retention rates
- Participation in high-impact practices such as faculty research, service learning, internships, study abroad
- Satisfaction levels, alumni salaries
- Student debt profiles, loan default rates
- University debt levels, cash balances
- State General Fund support for the institution, per student
- Net tuition (revenue minus institutionally provided finance aid)
- Instructional cost per FTE student and per credit hour
- Endowment size, annual gifts and pledges
For a small liberal arts university, it seems like a pretty comprehensive list. However, I would note that there are a few things that the dashboard does not measure — faculty and staff headcount, faculty-to-student ratios, staff-to-student ratios, average class sizes, faculty and staff compensation, and comparisons with peer institutions, among other productivity metrics. (And that’s just off the top of my head.)
While Paino’s dashboard does not provide all the data that I would like to see, were I on UMW’s Board of Visitors, it encapsulates more crucial information in one document than I have found for any other Virginia university. That’s not to say that other presidents don’t have similar dashboards, just that I haven’t seen them. As I come across others, I will share them with Bacon’s Rebellion readers.
Regardless, Paino deserves credit (a) for collecting the data, and (b) for sharing it with the BoV and the public. I’d like to see that best practice implemented across Virginia’s higher-ed system.

