
Last week at a State Council of Higher Education for Virginia (SCHEV) board meeting, board member Heywood Fralin launched into an impromptu digression on a topic of great frustration to him: the claim that for every dollar the General Assembly has cut in state support to higher education, state colleges and universities have increased tuition by two dollars.
“Reports about tuition increases lack perspective,” said Fralin, a successful businessman and former head of the University of Virginia Board of Visitors. The two-for-one claim might reflect reality if you pick 1996 as a starting date, he said, but if you select 2001 as the starting date, you would see a one-for-one match between state cuts and tuition increases.
Fralin was correct in pointing out that it matters which start and end dates are used in making a statistical analysis. But was the year 2001 any more reflective of reality when analyzing the impact of state budget cuts on tuition than the year 1996?
The two-for-one claim likely originated in a presentation by fiscal analyst Tony Maggio at a House Appropriations Committee retreat in November 2016. At that event, Maggio shared the following chart:
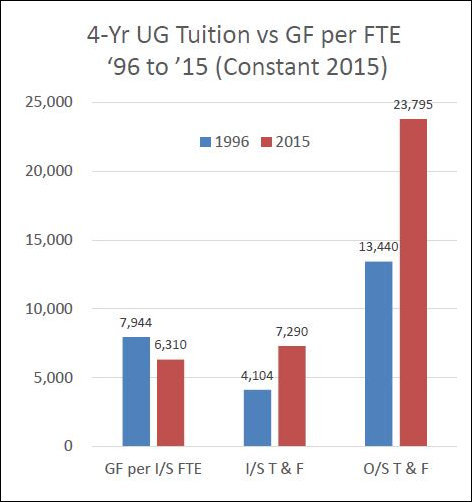
Translator key: UG = undergraduate, GF = General Fund, FTE = Full-time equivalent, T&F = tuition & fees, I/S = In-State, O/S = Out-of-State. Maggio’s bottom line: “Essentially, in-state tuition grew $2 for every $1 loss in General Fund.”
By Maggio’s calculation, state support per in-state student (nobody is terribly concerned about out-of-state students) shrank by $1,634 inflation-adjusted dollars between 1996 and 2015. Over the same period, average inflation-adjusted tuition & fees increased by $3,186, almost twice as much.
Legislators picked up this factoid during the 2017 General Assembly session. During a press conference highlighting several bills designed to reign in runaway tuition increase, Sen. Bill DeSteph, R-Virginia Beach, declared, “For every dollar we cut, they raise tuition two dollars.” The claim was repeated in newspaper ads paid for by Partners 4 Affordable Education (a Bacon’s Rebellion sponsor). I’ve repeated the number myself on this blog.
A March editorial in the Virginian-Pilot, cited by Fralin, took exception to the two-to-one meme.
When an advocacy group recently placed newspaper ads and op-eds asserting that Virginia colleges raise tuition $2 for every $1 dollar of state funding cuts, it was the wrong thing to do. It was misleading to the point of being false.
Over the 15-year period since 2001, there has been roughly a 1:1 correlation between state funding cuts and tuition hikes.
How do you get a figure of $2 in tuition increases per $1? By including cuts made between 1996 and 2001.
It could have been far more useful to evaluate the 15 years between 2001-2015. That would include the last two recessions, along with corresponding budget cuts and tuition increases.
It is interesting to see the Virginian-Pilot accuse the newspaper ad of being “misleading to the point of being false” for picking a start date that fit its narrative while the editorial writer did precisely the same thing! The table below (also prepared by Tony Maggio) shows how a starting date of 2001, when state support was highest, would include the cuts in state support that followed and exclude the increases that preceded it, thus biasing the findings in a totally different direction.
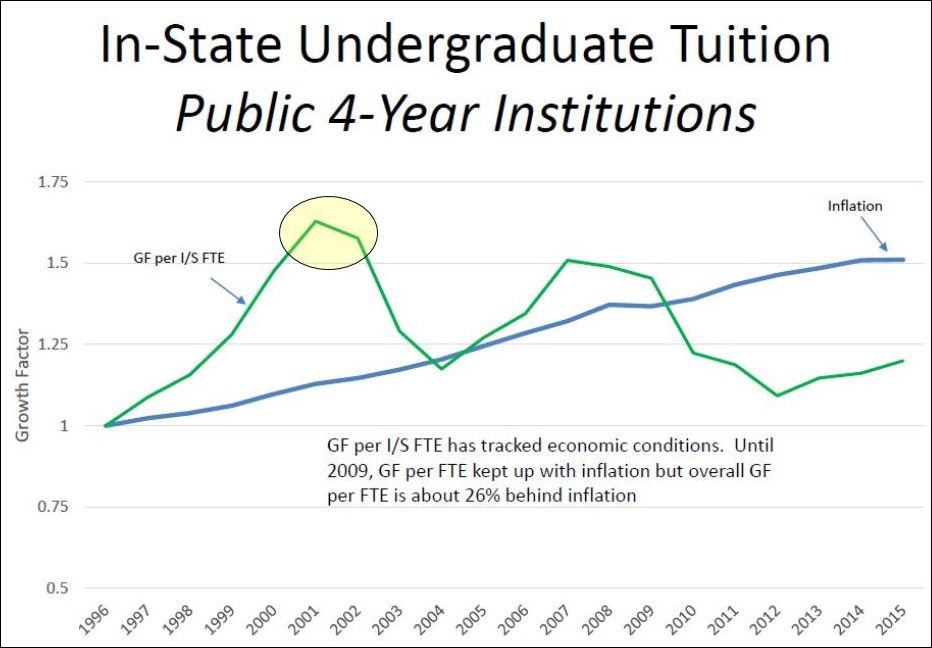
This graph, prepared by House of Delegates staffer Tony Maggio, shows General Fund support per in-state undergraduate student at Virginia’s public four-year institutions using a starting date of 1996. The yellow highlight (which I added) shows the starting date proposed by a Virginian-Pilot editorial writer.
The Pilot editorial writer did raise one interesting point: Perhaps comparisons should take into account the fiscal impact of the business cycle. In the writer’s view, it was important to “include the last two recessions, along with corresponding budget cuts and tuition increases.”
But why is it important to include the last two recessions, rather than the last one recession? Why are recessions more important than business expansions when tax revenues tend to be growing, not shrinking? Why not pick a date tied to key legislation, such as the 2005 Restructuring Act, which gave Virginia public colleges and universities more autonomy and freedom to raise tuition in exchange for more accountability to outcomes? Inevitably, the selection of a start is an arbitrary decision.
Why did Maggio pick 2006 for his starting date? Because, he told me, twenty years seemed like a reasonable amount of time to look back. But he could have gone back to the early 1980s when then-Governor L. Douglas Wilder slashed state support for higher education to balance the budget during a recession, or a few years later when, during an economic expansion, his successors tried to restore the balance.
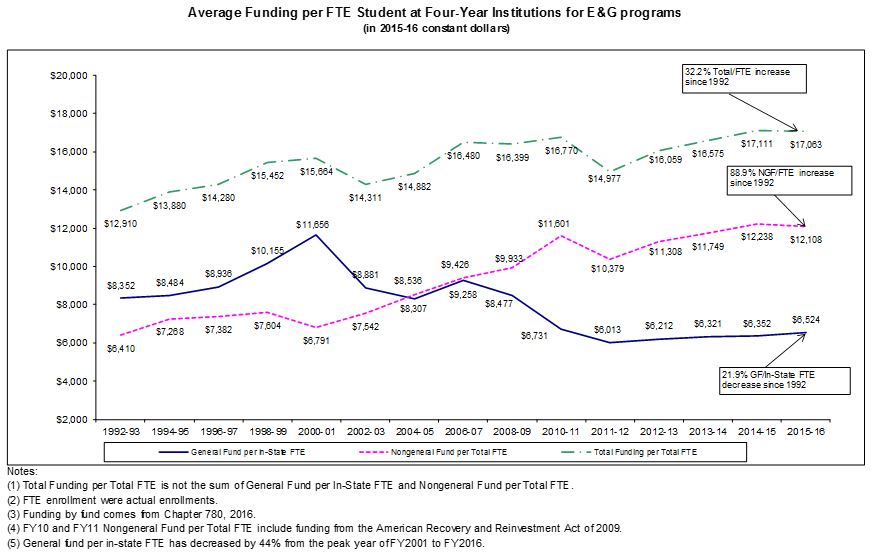
As it happened, SCHEV Director Peter Blake picked the 1992-1993 fiscal year as the starting point for his own analysis. A career state administrator who has occupied high-level positions in higher ed through multiple administrations, Blake makes a genuine effort to be an honest broker between higher ed’s many factions and constituencies.
(Click for larger image)
Blake’s graph shows that total, inflation-adjusted funding per student (seen in the green line above) has increased 32.2% since fiscal 1992. But the sources of revenue have changed dramatically. State support from General Fund revenues have declined 21.9% over the same period, while Non-General Fund revenues (basically, university revenues from all other sources) have increased 88.9% over the same period.
“The conclusions one reaches about tuition increases and general fund reductions depend on what year you use,” Blake says. “Well-meaning people can make good cases for choosing one year over another. I conclude from looking at the numbers that there is a connection between state funding and tuition increases, but there also are other factors that figure prominently into the price of college.”
By bringing at “Non-General Fund revenues” into the equation, Blake alters the framework for viewing the problem in an important way. Non-General Fund revenues include revenue sources such as student fees, room & board, athletic revenues, research grants, endowment monies, and more.
If we focus on tuition only, we limit our analysis to about 28% of the total cost of attendance for an in-state, undergraduate student. The price of tuition becomes politicized because state support goes to tuition only, and the proper level of state support is a political issue. But the cost of student fees, room and board also have risen more rapidly than the cost of living over the years. Universities and their defenders prefer to keep the focus on tuition, where declining state support is partially to blame, and keep the spotlight off room, board, textbooks and student fees, where the state is blameless.
Now, let’s make matters even more complicated. “Average tuition per student” covers tuition for undergraduate students, graduate students, and professional students (law school, med school, business school, etc.) The most politically sensitive question is the cost of attendance for undergraduate students, first, because there are far more undergraduates than others, and second because people figure that Ph.Ds., doctors, lawyers and MBAs will earn enough money to pay off their sky-high tuition, so who cares?
(For what it’s worth, Maggio’s numbers encompass undergraduates only. As I read his chart, Blake’s numbers encompass all students.)
Why does this matter? Because it does not cost the same to educate undergraduate students and graduate students. Indeed, Maggio suspects that undergraduate student tuition subsidizes graduate-student tuition, although he did not provide me any hard data to back that supposition. The issue of graduate-student subsidies takes us down another rabbit hole: the role of graduate students in the university ecosystem, and cross-subsidies within universities, the details of which are too complex to divert us here.
Thus, not only does it matter which dates you select, it matters whether you are comparing in-state versus out-of-state students, or undergraduate students versus all students. Maggio’s data and Blake’s data are not directly comparable because Maggio is looking at undergraduate students (which might be the right thing to in some circumstances) while Blake is looking at all students (which might be the right thing to do under other circumstances).
Similarly, one could draw distinctions between cuts in state support administered to community colleges, public, four-year colleges generally, and the elite institutions. State support is not ladled out or cut back evenly. Universities serving poor and minority student populations are deemed to be more vulnerable than, say, the University of Virginia and the College of William & Mary, therefore have suffered bigger reductions when the state is retrenching. Those same institutions also have greater pricing power in the marketplace, so they have raised tuition more aggressively.
Having awakened to these nuances, I will do my best to compare apples to apples, in my future writing about higher ed in Virginia. As to Fralin’s original gripe about that for-every-dollar-we-cut-they-increase-tuition-by-two-dollars meme, is there a single correct answer? No. All I feel safe in saying is that, averaged over time, the reality falls somewhere between Maggio’s two-to-one ratio and Fralin’s one-to-one ratio.

