
UVa president’s house. Will UVa’s new president open up the data needed for a honest and open dialogue about race and racism at the university?
As I blogged last week, the University of Virginia is organizing a seminar with the goal of equipping faculty to teach their disciplines “in relation to the history and present reality of race and racism both locally and nationally.” Sessions will “connect historical events and struggles with contemporary concerns such as health, educational, and economic disparities, as well as white supremacist discourse and actions and present efforts toward justice and equity.”
It was unfair of me in that post to suggest that the exercise might be dominated by a politically correct, social-justice-warrior perspective that will illuminate the views of white supremacists but give short shrift to mainstream conservative and libertarian thinking. UVa has assured me that the seminar will “encourage open dialogue among the seminar participants.”
I also have every confidence that the university will take an honest look at its own practices regarding race, not just in the past but in the present. In the spirit of open dialogue, I offer a few data points to consider.
A good place to start is the demographic breakdown of Virginia’s population (2010 census):
White — 68.6%
Black — 19.4%
Asian — 5.5%
Other — 3.7%
Multiracial — 2.9%
(Hispanics, a cultural group apportioned between the aforementioned racial groups, comprise 7.9% of the population.)
Now, here is a breakdown of UVa’s undergraduate student population, based on data from its Diversity Dashboard:
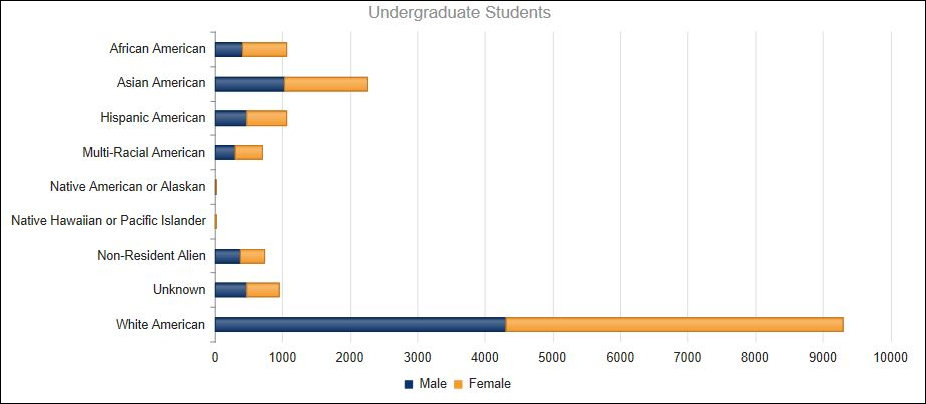
By percentage, that works out to:
White — 58.9%
Black — 6.5%
Asian — 14.0%
Hispanic — 6.5%
Multiracial — 4.3%
Other (foreign, unknown, other) — 10.6%
Even accounting for the differing ways of categorizing by race and culture, it’s clear that blacks are severely under-represented at UVa, Asians are over-represented, and whites are represented in rough proportion to their percentage of the overall population. Examine the charts on the UVa website for graduate students, staff, and faculty as well. While there are some differences (foreign students push up the “other” grouping among graduate students), comparable racial disparities exist across the board.
Here’s the first question. Do the disparities reflect institutional racism at the University of Virginia? Or do disparities reflect the dismal realities of the labor market (there are fewer African-Americans possessing the educational credentials to teach at UVa) and the dismal realities of the educational pipeline (fewer African-Americans meeting the UVa entry requirements)?
Here’s a second question. How does one account for the massive over-representation of Asian students — 14% of the student body but only 5.5% of the student population? Does UVa discriminate in favor of Asian students? Or does it have a meritocratic admissions policy that favors Asians based on objective criteria such as SAT scores, high school class rankings, and other factors?
Once we have touched upon those issues, we can move to a related matter. UVa has stepped up its diversity efforts over the past decade. Perhaps the university could document its dedication to the task by providing an accounting of the manpower and budget devoted to diversity. Yet the number of African-American students actually has declined from 1,199 in 2009 to 1,049 today. Has institutional racism at the university gotten worse, or might there be a different explanation? (Interestingly, the decline has been the most marked among African-American women. Has UVa become more sexist as well as more racist during this period?)
One way we can answer these questions is to provide admissions data that the university administration has heretofore held close to its chest. What is the average SAT score broken down by racial/ethnic group? If average SAT scores of African-Americans are higher than those of other racial/ethnic groups, we could reasonably conclude that they are being discriminated against. Conversely, lower scores would suggest that UVa admissions criteria are designed to increase representation of blacks. So, which is it? It is within UVa’s power to answer this fundamental question. Will it?
Another way to approach the issue of institutional racism is to examine graduation rates by race and ethnic origin. UVa publishes graduation rates for all students. According to UVa’s data, almost 90% graduate within four years, and 94% within six years. The university even publishes graduation rates for athletes (75% within four years). But curiously, it does not publish a breakdown by race. The information is vital to an open and honest dialogue, however, so I feel confident that the UVa administration will make it available.
It’s also curious that the State Council of Higher Education for Virginia, which maintains a voluminous database for all public colleges and universities, does not break down 4- or 6-year graduations by race. It does, however, break down graduation rates between “majority” students and “students of color.” The database does not define “students of color.” By common definition, however, the term refers to non-whites, thus it includes Asians as well as blacks, Pacific Islanders, and American Indians.
According to SCHEV data, “majority” students graduate from UVa within four years at a rate of 86.3%. (I can’t explain the discrepancy between UVa data and SCHEV data.) “Students of color” graduate at rate of 83.5%. Given the proclivity of Asians to out-perform all other racial/ethnic groups academically, it is reasonable to assume that they graduate at a rate at least as high as the white rate of 86.3%. Remove them from the “students of color” category, and the average four-year graduation rate drops to 80% or so. That’s just a guess, of course, but if I’m off, UVa can provide authoritative data any time it wants.
What accounts for the 6% to 7% disparity in graduation rate? Is the graduation gap evidence that UVa creates an environment that is hostile to blacks? If the graduation rate is higher for black women and lower for black men (as I suspect it is), does that mean the university environment is more hostile to black men than to black women, and, if so, how does that comport with the pervasive academic theory that black women are victims of both pervasive racism and sexism? I hesitate to bring up yet another possibility, but the question must be asked: Is it possible that campus identity-based ideology based on grievance and victimhood contributes to blacks’ sense of alienation and affects their commitment to graduate?
Another area worth examining is disparities in what students of different ethnic/racial origins pay to attend UVa. The university, the Commonwealth of Virginia, and the federal government dispense a significant amount of financial aid based upon the student’s family income. Whites on average come from more affluent families than blacks, so it goes without saying that they need, and receive, less financial aid. But any dialogue about “health, educational, and economic disparities” should take into account measures designed to reduce those disparities. Thus, it would be worthwhile to know how much whites pay for tuition on average versus how much blacks pay. If blacks benefit more than whites from financial aid, that discrepancy undercuts the idea of institutional racism. But we won’t know unless UVa publishes that data. Will it?
Any honest, open dialogue on race will encompass both perceptions and facts. The perceptions are real in the sense that people hold certain ideas about the world around them, but not all perceptions are equally grounded in the facts. It is important for UVa to provide the data so the discussion can proceed on the basis of both perceptions and facts.

