
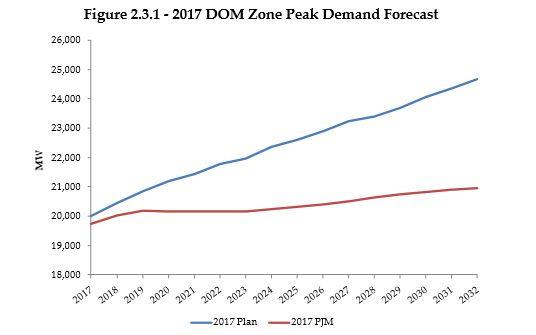
Comparison of Dominion and PJM growth forecasts in peak load. Source: Dominion 2017 Integrated Resource Plan.
Billions of investment dollars ride on the long-range forecast of Dominion’s peak load electricity demand. But whose projections do we believe — Dominion’s or PJM’s?
In its 2017 Integrated Resource Plan (IRP), Dominion Energy forecasts the increase in its peak electric load and anticipates what combination of new gas, solar and nuclear facilities it will take to meet that demand. Although the IRP is a highly technical document, against the backdrop of the debate over the future of Virginia’s electric grid, it has major political implications. Environmentalists argue that Dominion overstates future electric load and, consequently, it overestimates the number of new combustion turbines (gas-fired turbines designed to generate electricity on call) or the amount of new nuclear capacity that it will need to add.
As evidence, Dominion’s opponents point to the 2017 peak load forecast by PJM Interconnection, the regional transmission organization of which Dominion is a part. Where Dominion’s IRP projects an average annual increase in summer peak load of 1.4%, PJM projects an increase of only 0.4%. Projected over the 15-year planning horizon of the IRP, that amounts to a tremendous difference in peak electric load, as can be seen in the graph above.
Needless to say, Dominion defends its forecast, and offers detailed reasoning in the IRP to support its position.
Which forecast is correct? That of Dominion, which has a more intimate, granular knowledge of its service territory, of that of PJM, which has no profit-maximizing agenda?
It might come as a surprise to outsiders, given the big gap between their projections, but Dominion and PJM coordinate their planning and forecasts very closely. In most ways, the two forecasts are closely aligned. In PJM’s estimation, the difference boils down to two main factors: (1) the assumptions that Dominion and PJM make about the growth in demand from energy-intensive data centers beyond 2021, and (2) assumptions about how to account for rapidly “behind-the-meter” electric generation by homeowners and businesses. To those two issues, Dominion adds two more arcane issues of methodology.
Data centers. Data centers figure largely in Dominion’s forecasts because Northern Virginia has emerged as one of the world’s leading clusters of energy-intensive server farms, drawing upon the region’s rich network of high-capacity fiber-optic cable, low-cost electricity, tech-savvy workforce, and friendly state-local policies. Having observed the success of Loudoun County, other Virginia localities from Virginia Beach to Wise County in far Southwest Virginia, are getting into the act.
Data centers are an anomaly for economic and electric-load forecasters. Because they are such big consumers of electricity to run thousands of servers and cool the heat they throw off, they skew the normal relationship between economic growth and energy consumption. Accordingly, Dominion and PJM have to make special adjustments to their economic models to take them into account.
“Each year Dominion comes to us with information about their projections of data center growth,” says Tom Falin, director of resource adequacy planning for PJM. “We do analysis to see if that growth is already embedded in our forecast. In general, it isn’t. [Data centers] put a drain on the energy grid that’s not normally associated with economic growth — there’s not a lot of employment and housing associated with it.”
Data-center loads reached more than 800 megawatts by 2016 and are projected to amount to 1,500 megawatts by 2021. That compares to a total peak load of about 20,000 megawatts for Dominion. PJM estimated that it needs to adjust Dominion’s peak load forecast upward by 500 megawatts by 2021 to account for the data centers. At that point, says Falin, PJM assumes that the growth in energy demand will be embedded in the historical load history and won’t require further adjustment. “Perhaps Dominion is assuming stronger growth in these data centers than we are.”
Indeed it is. As Dominion explains in its 2017 IRP:
PJM has eliminated new data center growth in the DOM Zone beginning in 2021 – in other words, it excluded incremental data center growth beyond what is captured in historic trends. This is a significant change from PJM’s 2016 peak demand forecast, which included new data center growth continuing for the balance of the forecast. In comparison, the Company utilizes historical trend data center load coupled with interconnect data from new and existing data center customers to forecast data center growth within its service territory. Over the longer term, the Company relies on data center forecasts that are included in a 2015 study prepared for the Company by Quanta Technology, LLC, entitled “Dominion Northern Virginia Load Forecast.”
The difference between the Dominion and PJM forecasts can be seen in this graph taken from the 2017 IRP:
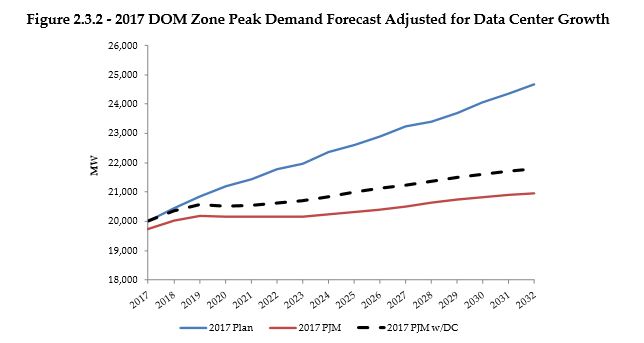
Source: Dominion 2017 IRP.
The dotted line shows what PJM’s peak demand forecast would look like if adjusted for data-center growth.
Behind-the-meter generation. Another leading factor affecting peak electricity load is the increase in “behind-the-meter” generation (also referred to as distributed energy) — typically solar panels installed on the roofs of houses and commercial buildings. Because most of the electricity is consumed on the spot and never enters the grid, PJM treats growth in output as a reduction in demand on the Dominion grid, not as new supply.
“We don’t count that generation. We see it as reduced load,” says Falin. As part of its forecasting process, PJM contracts with an outside firm to supply a projection across the PJM territory. PJM estimates that behind-the-meter will deduct about 300 megawatts in 2021 from the peak load growth that Dominion otherwise would experience. “Dominion does not make that adjustment,” he says. “They understand that the trend is occurring but they’re uncomfortable counting on those solar panels producing energy at peak demand.”
Dominion’s reasoning is esoteric and not easily explained. But we’ll give it a try… The big challenge of integrating renewable energy into the electric grid is its variable and intermittent production. Electric utilities (and regional transmission organizations) must create sophisticated models to simulate the fluctuations in supply and demand in order to keep the two in constant balance on a second-by-second basis. A higher percentage of renewables creates more variability and fluctuations. Netting out the behind-the-meter capacity makes sense for the purpose of calculating the supply of electricity on the grid. But that doesn’t change the problem of dealing with the variability. If you classify behind-the-meter generation as part of the electricity supply, output varies with weather conditions and time of day. If you classify it instead as off the grid, the the demand of houses and businesses for juice from the grid still varies. Either way the fluctuations occur, and they must be modeled.
“As a result,” says the Dominion IRP, “the generation and transmission systems needed to support the true load could be underestimated should these [distributed energy resource] facilities underperform during critical system conditions.”
Dominion goes on to quote a document of the North American Energy Reliability Corporation (NERC) as saying, distributed grid resources “should not be netted with load but modeled in an aggregate and/or equivalent way to reflect their dynamic characteristics and steady-state output.”
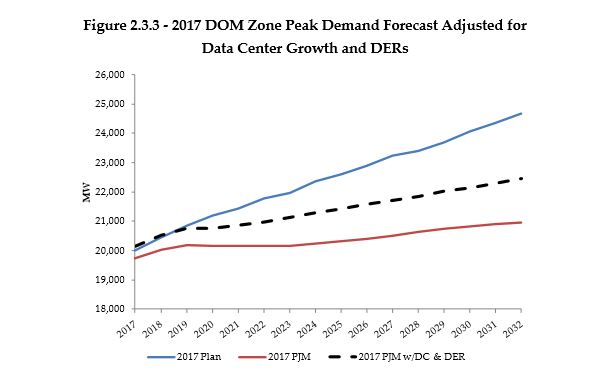
Dominion peak demand forecast adjusted for data centers and distributed generation.
Other factors. Dominion points to a third factor: appliance efficiencies and saturation. PJM draws data from a U.S. Energy Information Administration forecast for the South Atlantic Census Region (encompassing eight states and Washington, D.C.), while Dominion draws from surveys of customers in its service territory. The company considers the more granular data more accurate than EIA’s regional data.
A fourth difference is the way that PJM and Dominion account for the local, state and government sector, which accounts for 13% of the economy. PJM, asserts the Dominion IRP, assumes only three customer sectors: residential, commercial and industrial. Dominion breaks out government as a separate sector.
Incorporating appliance efficiencies/saturation and the government sector on top of data centers and distributed generation, says Dominion, narrows the difference between Dominion and PJM forecasts to insignificance, as seen below.
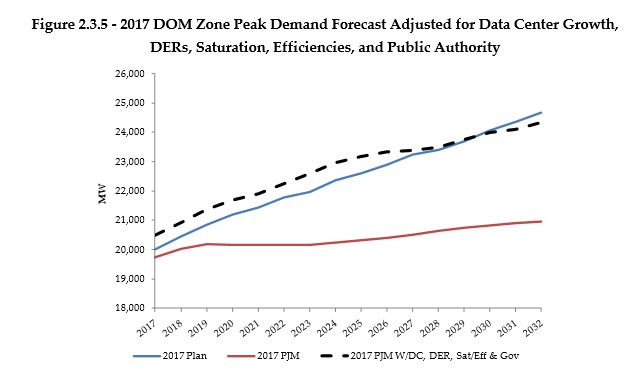
The dotted line shows PJM’s peak load forecast after adjustments for data centers, distributed energy, appliance efficencies/saturation, and government.
Bacon’s bottom line: While it is true that PJM’s forecast for peak load growth is significantly lower than Dominion’s, the gap does not reflect fundamental differences in the outlook for economic growth, advances in solar generation, or the inroads of energy efficiency. The divergence can be attributed to four narrow issues:
- How to account for growth in data-center demand after 2021;
- How to classify distributed, “behind-the-meter” generation;
- Whether to use regional EIA data or Dominion-specific survey data to estimate changes in residential appliance consumption; and
- Whether or not to break out government as a separate economic sector.
The distance between the PJM and Dominion forecasts may be more apparent than real. Any debate over the validity of the projections need to focus tightly on these narrow-bore issues.

